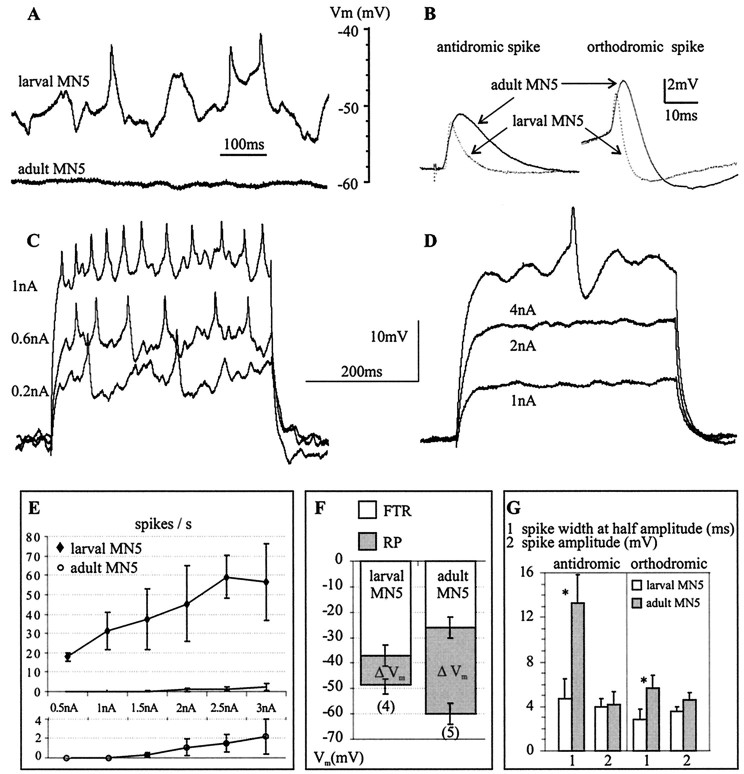
Fig. 1.
Excitability of the “slow” larval and the “fast” adult MN5. A, Representative intracellular recordings of spontaneous activity recorded from the cell body in the larval (toptrace) and the adult (bottomtrace) MN5 in the isolated ganglion preparation. B, Larval (dotted lines) and adult (solid lines) orthodromically and antidromically evoked spikes. Each trace represents a signal average of eight spikes taken from a representative recording.C, D, Representative responses of the larval (C) and the adult (D) MN5 to current injection into the soma. E, Injected current plotted against evoked firing frequency (I/F relationship). Top, I/F relationships for the larval and the adult MN5 created from five recordings each.Bottom, The adult I/F relationship shown again at an expanded scale. F, Average resting potential and average firing threshold for the larval and the adult MN5. Error bars represent SDs. The average voltage difference between the resting potential (RP) and the firing threshold (FTR) is defined as ΔVm and indicated by gray bars. G, Average spike amplitude (millivolts) and average spike duration at half amplitude (milliseconds) for the antidromically and for the orthodromically evoked spike of the larval (white bars) and the adult (gray bars) MN5. Statistically significant differences between the larval and the adult stages are indicated by asterisks(p < 0.001). Error bars represent SDs.

