
Fig. 10.
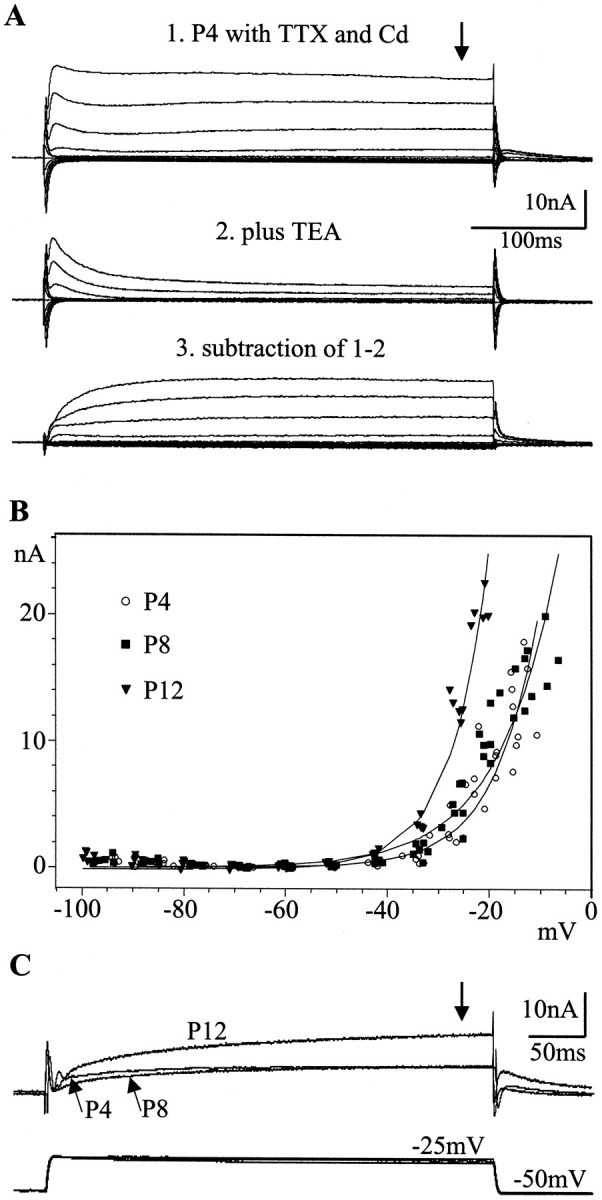
Developmental modifications of potassium currents in MN5. A, Panel 1, Total potassium current was recorded in dSEVC mode from MN5 at pupal stage P4 with TTX (10−8m) and cadmium (0.5 m) in the bath. Panel 2, Bath application of TEA (30 mm) affected the sustained component of the outward current significantly, although the transient component was also reduced. Panel 3, Subtraction of the residual transient component from the total outward current revealed the sustained component. B, I–Vrelationships for the total potassium current (seetraces in A) at pupal stages P4, P8, and P12 are shown. Total current was measured at 350 msec of each voltage step (see arrow in A) and plotted against the actual instantaneous membrane potential (see Results). Five recordings were plotted for each stage, and curves were fitted using the simplex method. The I–V relationships for pupal stages P4 and P8 showed no significant difference, but thefittedcurve for pupal stage P12 was significantly steeper. C, Typical current responses of MN5 at the stages P4, P8, and P12 are shown after bath application of TTX and cadmium to voltage steps from a holding potential of −50 mV to an actual membrane potential of −25 mV. The bottomtraces show the voltages recorded at the three different stages, and the toptraces show the current responses.