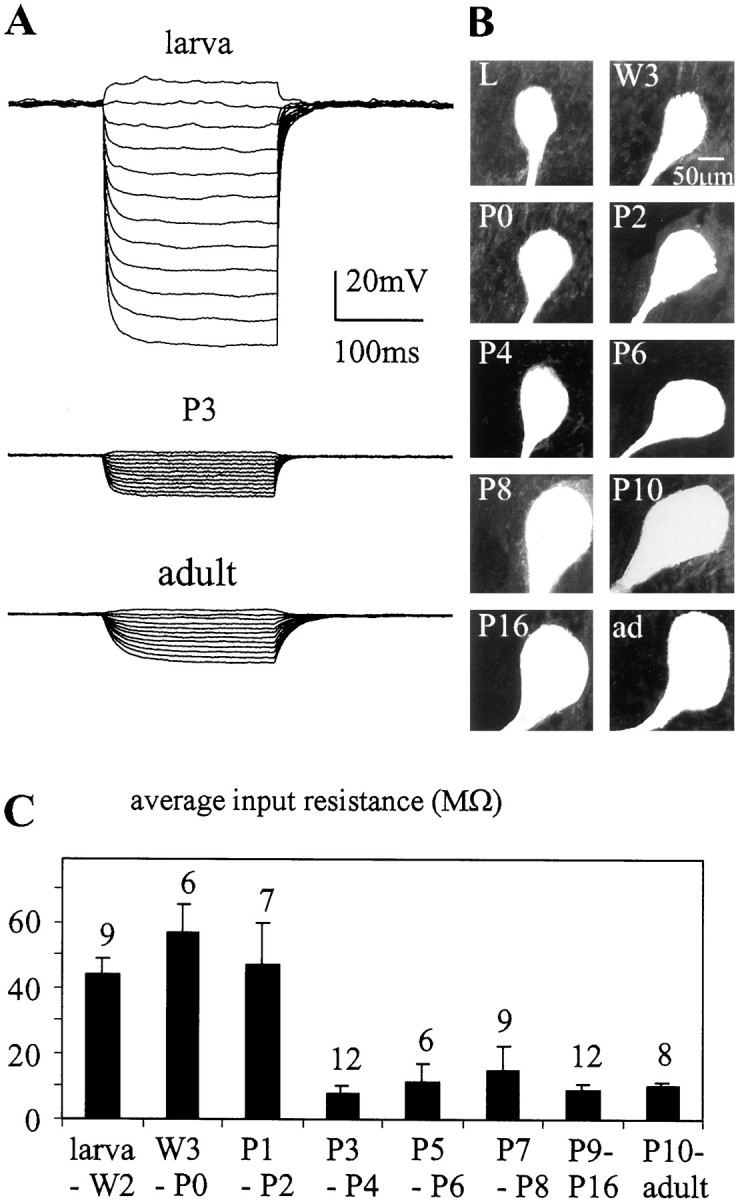
Fig. 5.

Changes in input resistance during postembryonic development. The input resistance of MN5 was recorded in DCC mode at different developmental stages. A, Representative voltage responses of MN5 at the larval stage, pupal stage P3, and the adult stage to 12 steps of current injection between −2 and 0.2 nA.B, Confocal images of the cell bodies of MN5 at different developmental stages. C, Average input resistances for different developmental stages. Thenumber of recordings for each group is presentedabove each bar. Error bars represent SDs.
