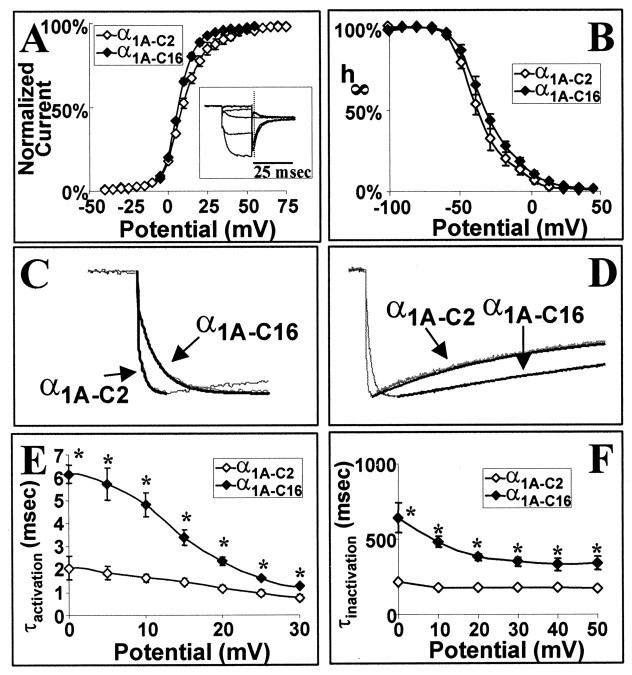
Fig. 3.
Voltage dependencies and rates of inactivation and activation of α1A-C2 and α1A-C16 subunit complexes. A, Voltage dependence of activation of α1A-C2 and α1A-C16 as measured from tail current measurements. Inset, Tail currents that were measured after the capacitive current (dashed vertical line) at 0 mV after a 20 msec depolarization to the test potential (−40 to +75 mV in 5 mV increments). Tail currents were normalized to the largest tail current in each series of test pulses. These data were fit with a Boltzmann equation: % I= 1/[1 + exp(−(Vtest − V1/2)/k)]. B, Isochronal inactivation of α1A-C2 and α1A-C16. A 20 sec conditioning pulse ranged from −100 to +40 mV in 10 mV increments. The conditioning pulse was followed by a test pulse to +20 mV for 300 msec. Data were fit with a Boltzmann equation: % I= 1/[1 + exp((Vtest − V1/2)/k)]. C, Single-exponential fits of activation of α1A-C2 and α1A-C16 at +20 mV. Fits are shown as solid black lines. D, Single-exponential fits of inactivation of α1A-C2 and α1A-C16 at +20 mV. Fits are shown as solid black lines.E, Average τactivation of α1A-C2 and α1A-C16 between the voltages 0 and +30 mV. Traces were fit with a single exponential from the onset of the inward current to the time of peak current. For this and all following figures, the asterisks denote statistical significance (p < 0.01) by the use of an ANOVA test. F, Average τinactivation between −10 and +50 mV for α1A-C2 and α1A-C16. Eachpoint represents a minimum of six recordings. The SEM for each point is shown unless the values were smaller than the symbol. Traces were fit with a single exponential from the peak inward current to the end of the depolarization.

