
Fig. 3.
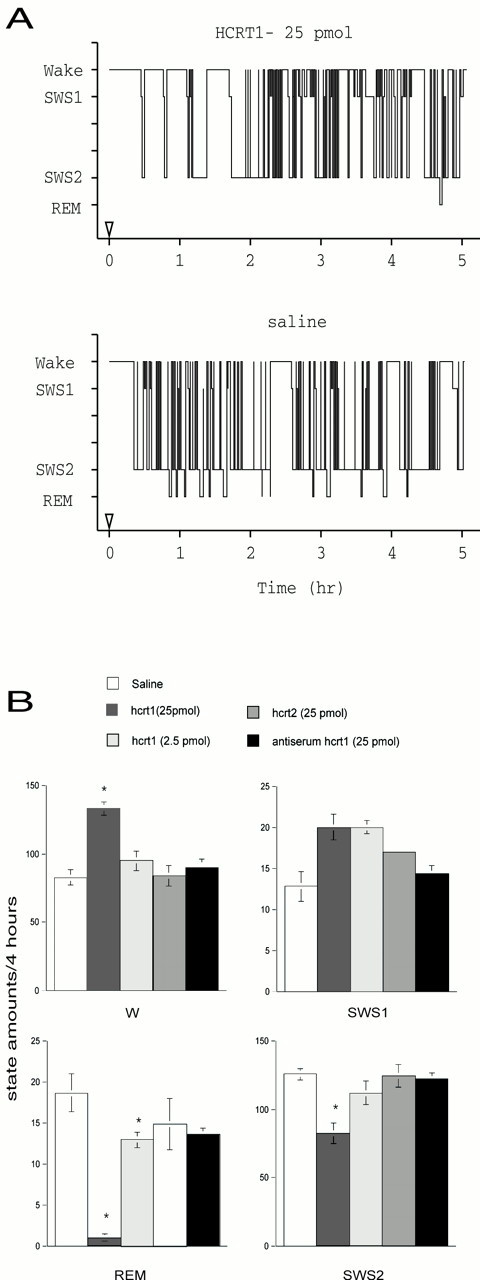
Effects of hcrt1 and hcrt2 on the amounts of W, SWS1, SWS2, and REM sleep after microinjection into the LC.A, Bars represent the amounts of the states of vigilance (mean ± SEM) expressed in minutes (saline,n = 7; hcrt1, 25 pmol, n = 7; hcrt1, 2.5 pmol, n = 5; hcrt2, 25 pmol,n = 4; hcrt1, 25 pmol, + antiserum,n = 4). *Significant difference (p < 0.05, Fisher's exact test) from baseline (rats treated with saline; open bars).B, Representative hypnographs obtained from one rat during 5 hr after the infusion of the vehicle (bottom) and 25 pmol of hcrt1 (top) into the right LC.