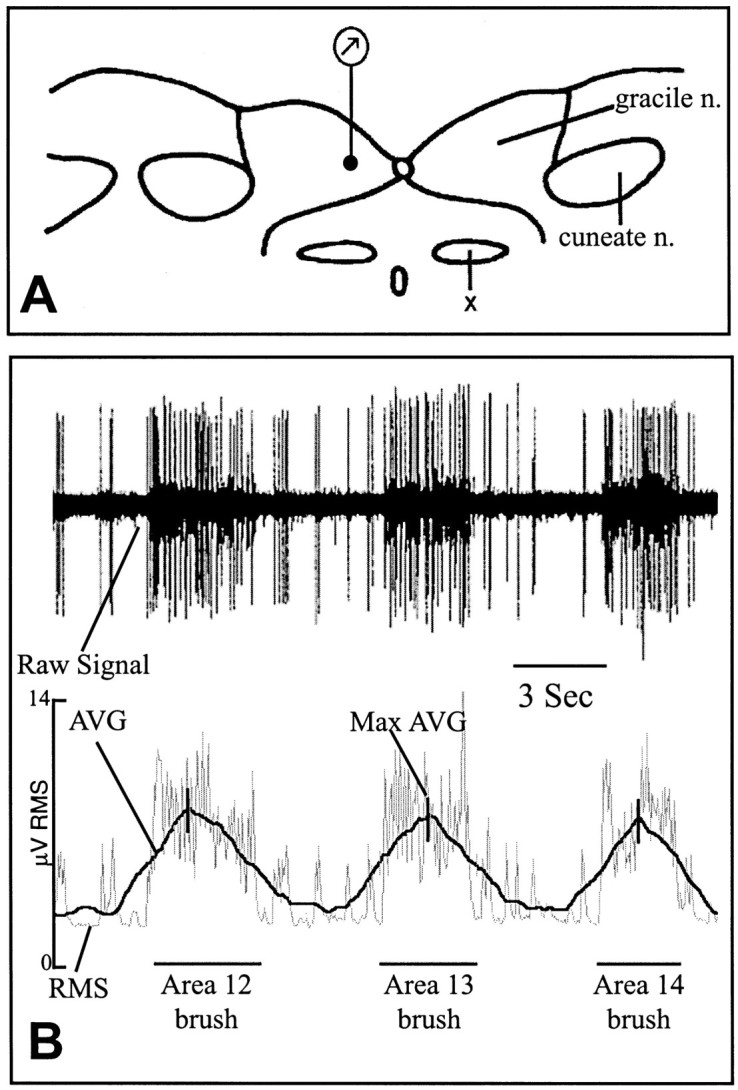
Fig. 2.

Recording site and data analysis.A, Diagram of a transverse section through the rat brainstem at the level of obex indicating the single recording site (dot at bottom of recording symbol), which was 200 μm lateral to the midline and 200 μm ventral from the surface. X, Nucleus of the solitary tract. B, RMS calculation from the raw multi-unit signal. The top line is a raw multi-unit recording from one rat during skin stimulation of regions 12–14 (see Fig. 1A,B). Thebottom line illustrates and labels the components of the analysis program (see Materials and Methods). The Max AVG generated during each stimulus is demarcated by a vertical slash mark.
