
Figure 2.
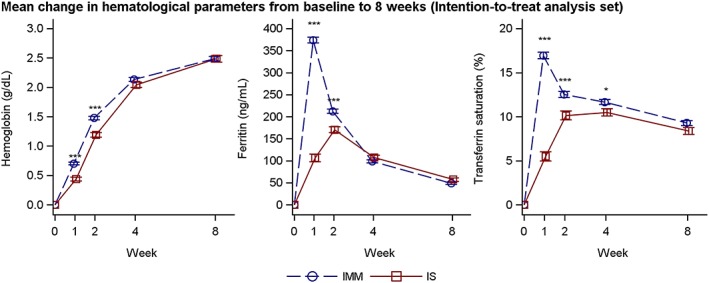
Hemoglobin, s‐ferritin, and transferrin saturation over time by treatment group (intention to treat analysis set). Estimates (mean and SE) from a mixed model with repeated measures with strata, treatment and time as factors, treatment*time and baseline value*time interactions and baseline value as covariate. IMM, iron isomaltoside 1000/ferric derisomaltose; IS, iron sucrose. *P < .05, **P < .001, ***P < .001