
Fig. 4.
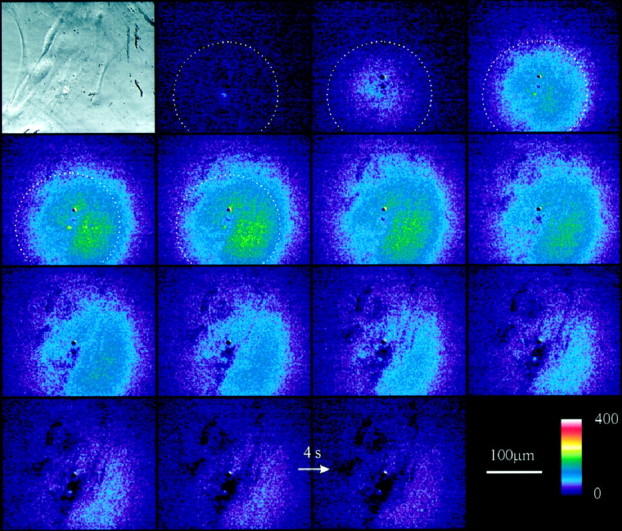
Time-lapse imaging of NADH fluorescence after stimulation of astrocytes. The image in the top left corner is a phase-contrast micrograph of the cultured astrocytes. The sequence of fluorescence images, which runs fromtop left to bottom right, (camera integration time, 2 sec) was collected during stimulation of an astrocyte within the optical field. In the presence of GDH and NAD+ a wave-like appearance of fluorescent NADH can be seen that results from the release of glutamate from the astrocytes. The color scale indicates linear pseudocolor representation of fluorescence intensity ranging from 0 to 400. A 200-μm-diameter circle, centered around the site of stimulation, is superimposed on the first five images. Comparison with the calcium wave shown in Figure 1 shows that the speed of the NADH (glutamate) wave is similar to that of calcium waves. Arrow, 4 sec image interval.