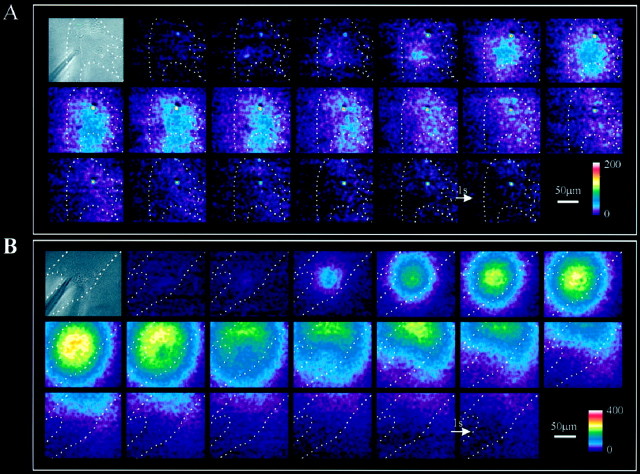
Fig. 7.
Spatial distribution of NADH fluorescence in a nonconfluent astrocyte culture. A, The bright-field image at the top left corner shows an optical field just partially covered by cells (inside the region defined by thedotted line). The shadow in thebottom left corner represents the position of the glass pipette, which was used to mechanically stimulate an underlying astrocyte. The series of fluorescence images shows the spatial dynamics of NADH fluorescence, and thus extracellular glutamate, after mechanical stimulation. Note that the interval between each frame (integration time = 0.4 sec) is 1 sec (arrow), instead of 4 sec as in Figure 4. Each image had the image that was collected 3 sec early subtracted from it ([n − (n − 3)]). The color scaleindicates linear pseudocolor representation of fluorescence intensity ranging from 0 to 200. B, Second example of the spatial proximity of the NADH fluorescence signal to the underlying astrocytes. A nonconfluent culture of purified astrocytes is shown in the bright-field image that is located at the top left corner. The set of fluorescence images shows the spatiotemporal dynamics of the NADH fluorescence. Note that near the end of the image sequence, increases in NADH fluorescence are located in the top right portion of the field of view as the calcium wave (data not shown) presumably propagates to neighboring astrocytes that are outside of the field of view (see Results for further explanation). The images were processed as [n − (n − 3)] and low-pass-filtered.Arrow, 1 sec image interval. The color scale indicates a linear pseudocolor representation of fluorescence intensity ranging from 0 to 400.

