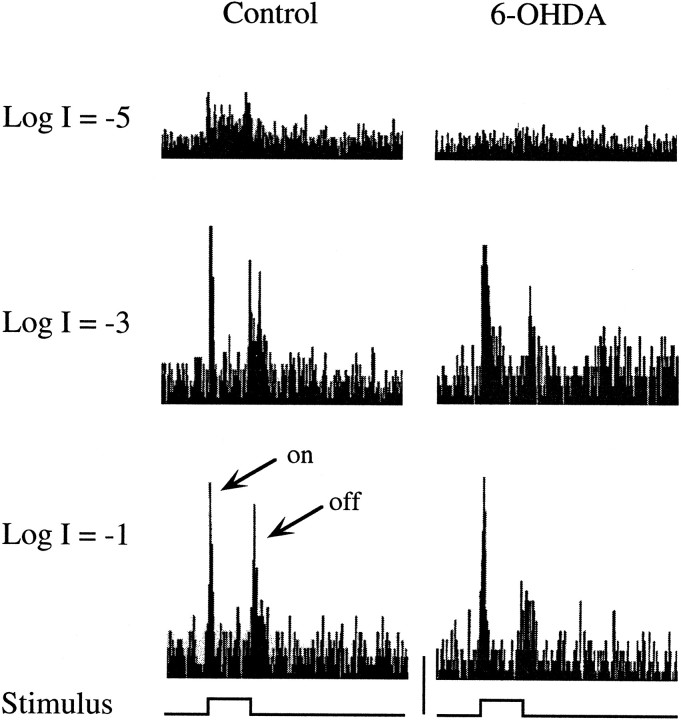
Fig. 4.
Representative ganglion cell discharge histograms from control (left) and DA-IPC-depleted zebrafish (right). Light responses to 0.5 sec of bright (logI = −1.0), medium (log I = −3.0), and dim (log I = −5.0) illumination were recorded from the optic nerve. With bright and medium illumination, ganglion cell ON and OFF responses were recorded from both control and DA-IPC-depleted fish. No obvious ganglion cell discharge was observed in DA-IPC-depleted animals when tested with dim illumination, unlike the control fish in which both ON and OFF responses were recorded, along with some sustained discharge, to this light level. on, ON responses; off, OFF responses. Calibration (bottom center): 40 spikes/sec.

