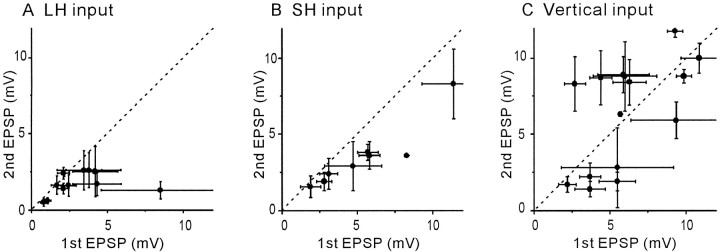
Fig. 5.
A summary of paired-pulse experiments on the three different input pathways. Each dot denotes the average value from one experiment. Horizontal andvertical bars show the SD of the amplitudes of the first and second EPSPs, respectively. Dashed diagonal linesindicate that the amplitudes of the first EPSPs are the same as those of the second. The second EPSPs were significantly depressed compared to the first in 9 of 11 cell pairs for paired-pulse stimulation of LH input and in all eight pairs for that of SH input. Paired-pulse stimulation of vertical input resulted in either significant facilitation (6 of 15) or depression (7 of 15) of the second EPSPs.

