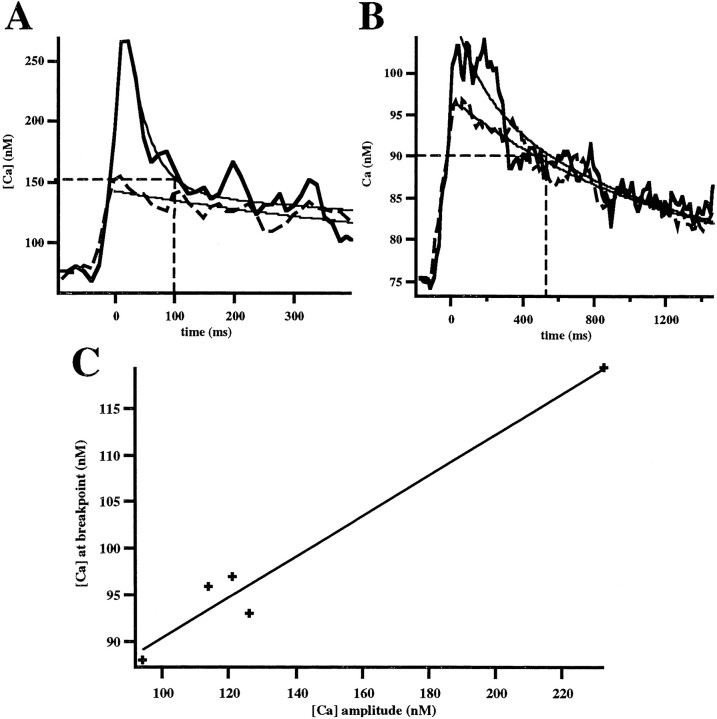
Fig. 2.
Dependence of the breakpoint of spine decay kinetics on peak [Ca2+]i.A, [Ca2+]i decay kinetics in spine and dendrite, showing the double- and single-exponential fits to the decay. Note how at ∼150 nm[Ca2+]i the spine switches from a fast to a slow time scale (breakpoint marked with grid lines). The trace was filtered with a three point smoothing kernel; average of six traces. B, Data from a different spine, showing a breakpoint (grid lines) at 90 nm [Ca2+]i. Data were filtered with a three point smoothing kernel; average of eight traces.C, The [Ca2+]i at which the breakpoint occurs can change within a single spine. Shown is [Ca2+]i at breakpoint (taken as [Ca2+]i at three initial fast time constants) plotted against peak [Ca2+]i in a single spine during loading with extrinsic buffer. If intrinsic buffer saturation is responsible for the double-exponential kinetics observed in spines, the [Ca2+]i at the point of the breakpoint should stay constant and correspond to theKD of the intrinsic buffer. Therefore, these data rule out that the double-exponential decay kinetics observed in spines is attributable to buffer saturation.

