
Fig. 3.
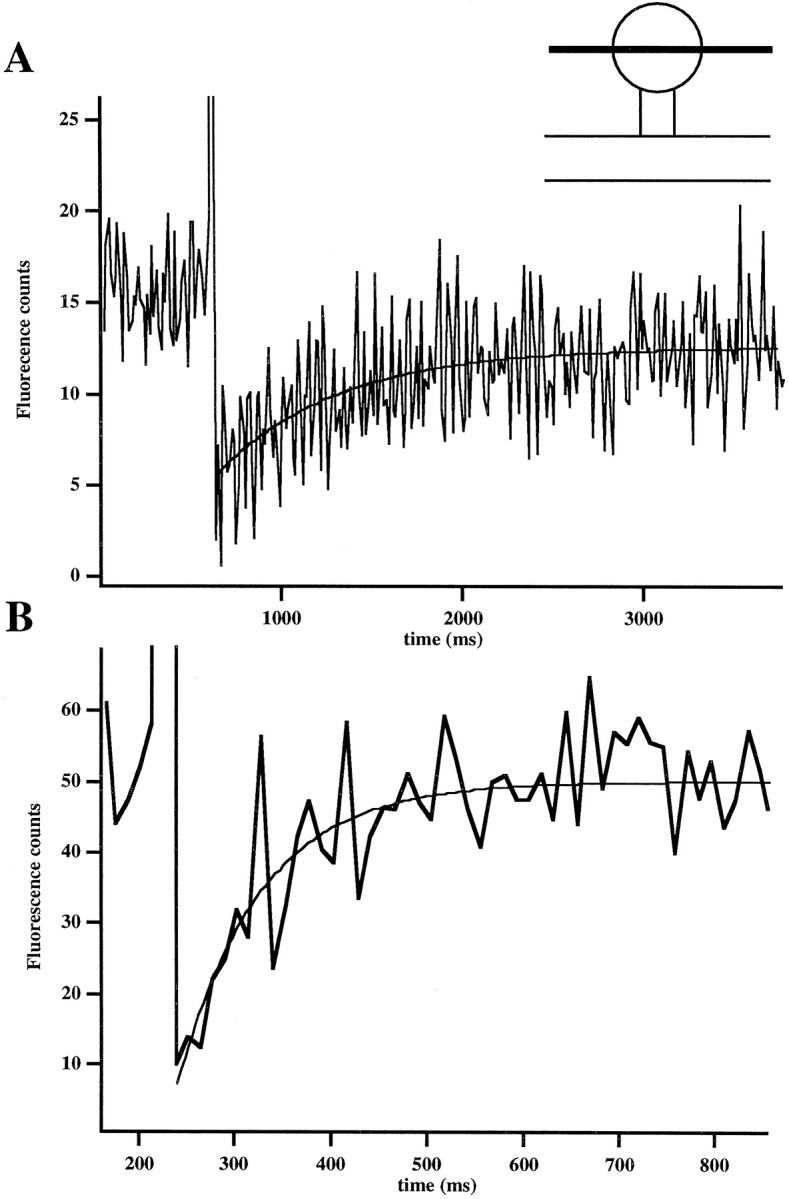
Slow diffusion of calcium green. A,Measurement of calcium green diffusional recovery time in a spine. The graph shows the fluorescence intensity kinetics in a spine. The high-intensity laser pulse (800 μsec exposure produced with 20 msec increase in intensity in line scan mode) produces a sharp decrease in the fluorescence intensity. Immediately afterward, unbleached fluorophore diffuses in from the dendrite, causing a rise in the fluorescence intensity. The recovery curve of the diffusion of unbleached fluorophore was fit to a single exponential (τ = 671 msec; average of five traces, unfiltered). Inset shows the positioning of the line scan used to bleach the dye in the spine, but not the dendrite. B, Measurement of fura-2 diffusional recovery in a spine. The recovery curve of the diffusion of unbleached fluorophore was fit to a single exponential (τ = 87 msec; average of 10 traces, unfiltered).