
Fig. 4.
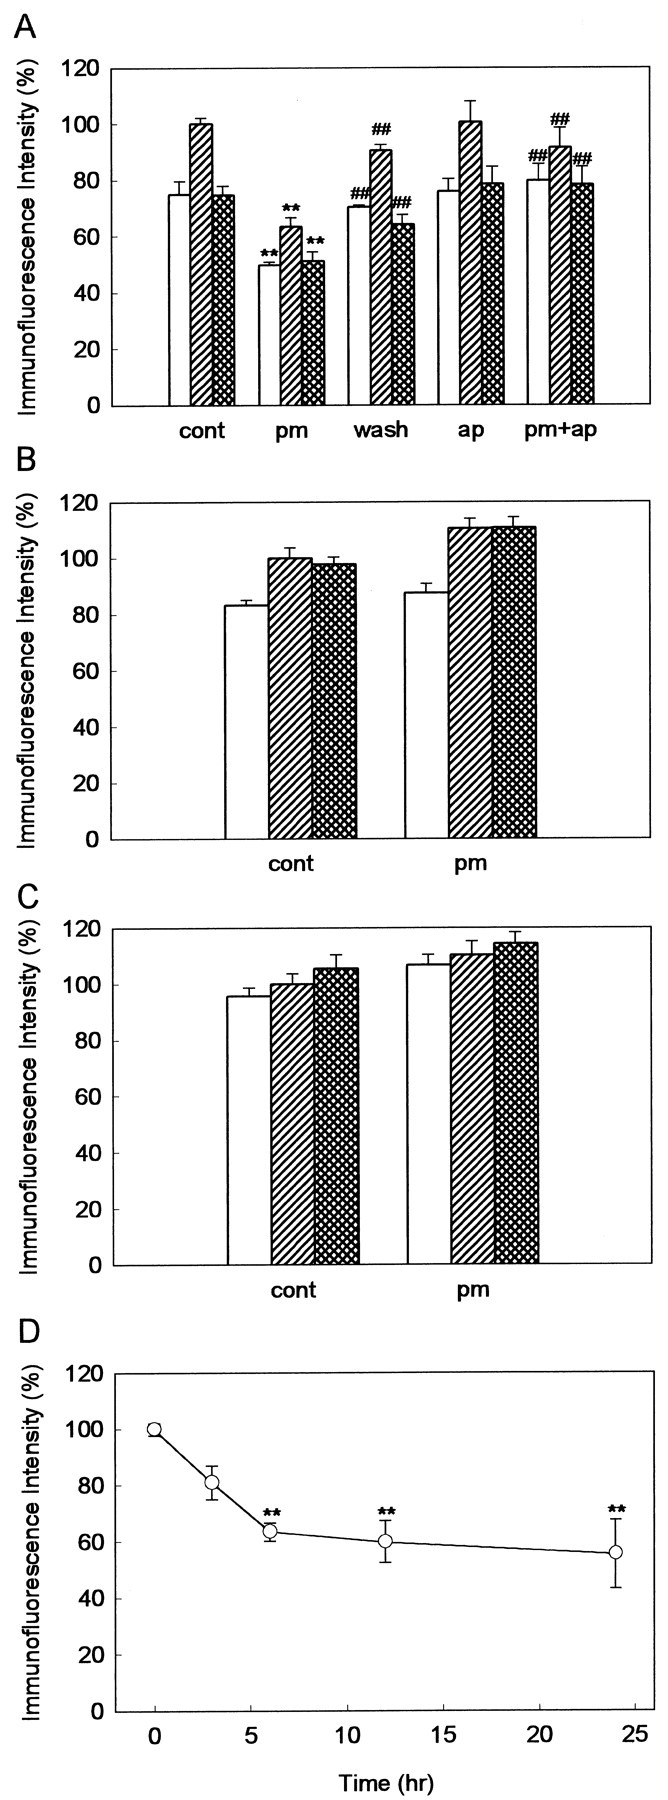
Quantitative analysis of the expression level of laminin (A), fibronectin (B), and type IV collagen (C) in the stratum oriens (open columns), the pyramidal cell layer (hatched columns), and the stratum radiatum (cross-hatched columns) of the CA1 area. cont, Control slices;pm, slices pretreated with plasmin; wash, slices cultured for 24–48 hr after washout of plasmin;ap, slices pretreated with α2-antiplasmin alone, pm+ap, slices pretreated with plasmin and α2-antiplasmin. There was no significant difference between the cont and apgroups. **p < 0.01 versus control slices; ##p < 0.01 versus plasmin-pretreated slices;n = 4–6. D, The time course of laminin degradation during plasmin treatment in the CA1 pyramidal cell layer. Results are expressed as the percentage of the value immediately before addition of plasmin (time 0). **p < 0.01 versus the value at time 0; n = 4–6.