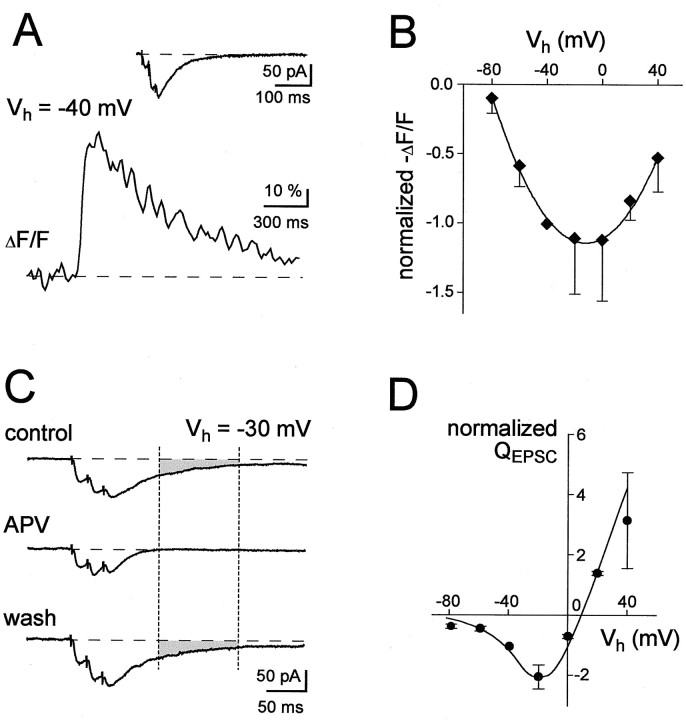
Fig. 5.
Fluorescence–voltage relationships (F–V) of synaptic Ca2+transients in spines. A, Representative example of a transient evoked by a brief burst stimulation recorded atVh = −40 mV. The insetshows the associated EPSC, traces are averages of five individual recordings. The intracellular solution contained D890 (2 mm) and the low-affinity calcium indicator dye Magnesium Green (Kd, ∼6 μm, 300 μm). B,F–V relations of the peak amplitude of the spine Ca2+ signals as measured with Magnesium Green (n = 3–6 measurements from 6 cells). Data were normalized to the values obtained at −40 mV. The line represents a polynomial fit of the data. C, EPSCs recorded atVh = −30 mV. Bath application of APV reversibly abolished a late component (shaded area) that was quantified (D) by integrating the EPSC between 60 and 160 msec (indicated by broken lines) after the last peak of the EPSC. EPSCs are averages of three consecutive responses evoked by triplet stimulation. D,Charge–voltage relationship (Q–V) of the late EPSC component, measured as indicated in C. Data were obtained from the cells that were analyzed in B. Error bars represent SD (n = 3–6 measurements from 6 cells). The intracellular solution contained 2 mm of D890 (A–D). Synaptic responses were evoked by two or three stimuli at 50 Hz.

