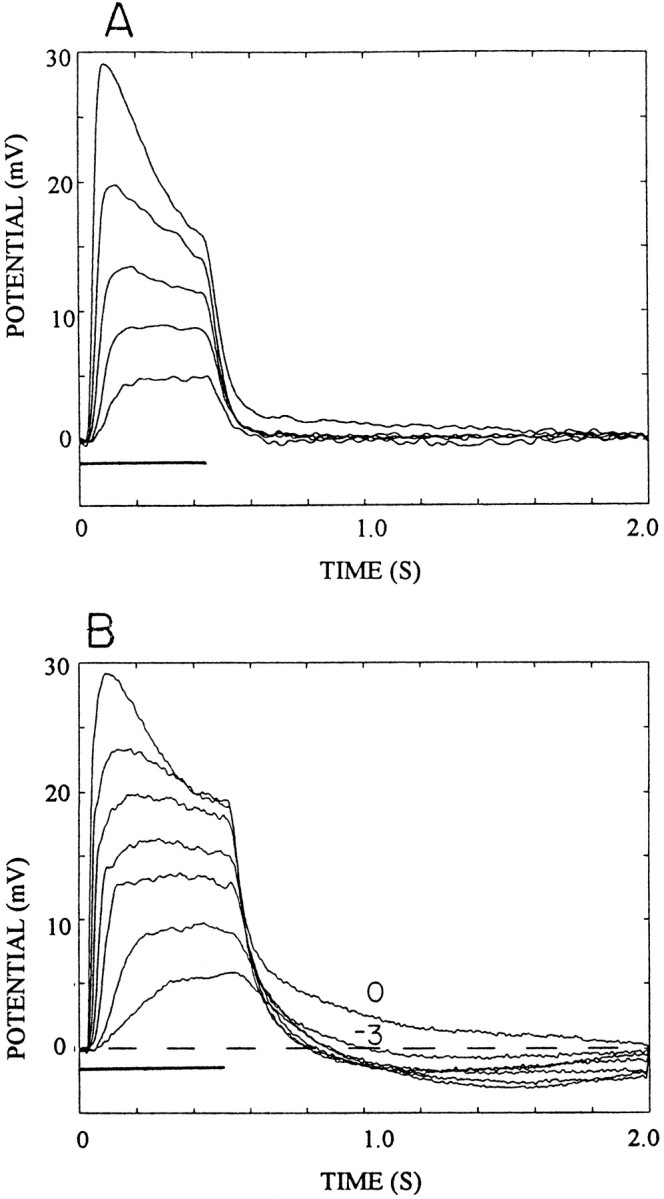
Fig. 3.

Comparison of the afterpotentials of soma and axonal photoreceptor responses elicited with broad-field (20° solid angle) illumination. A, Soma responses to 0.5 sec light flashes (horizontalbar atbottomleft). Intensity was varied in 0.5 log10 unit steps from −2.0 to 0. Each traceis the average of five responses. B, Axonal recordings of responses to 0.55 sec flashes with intensity varied from −3.0 to 0 in 0.5 log10 steps. Each trace is the average of five responses. The brokenline indicates the membrane resting potential that is taken as 0 mV. The afterpotentials at log intensity −3 and 0 are labeled. All other intensities produced similar afterpotentials.
