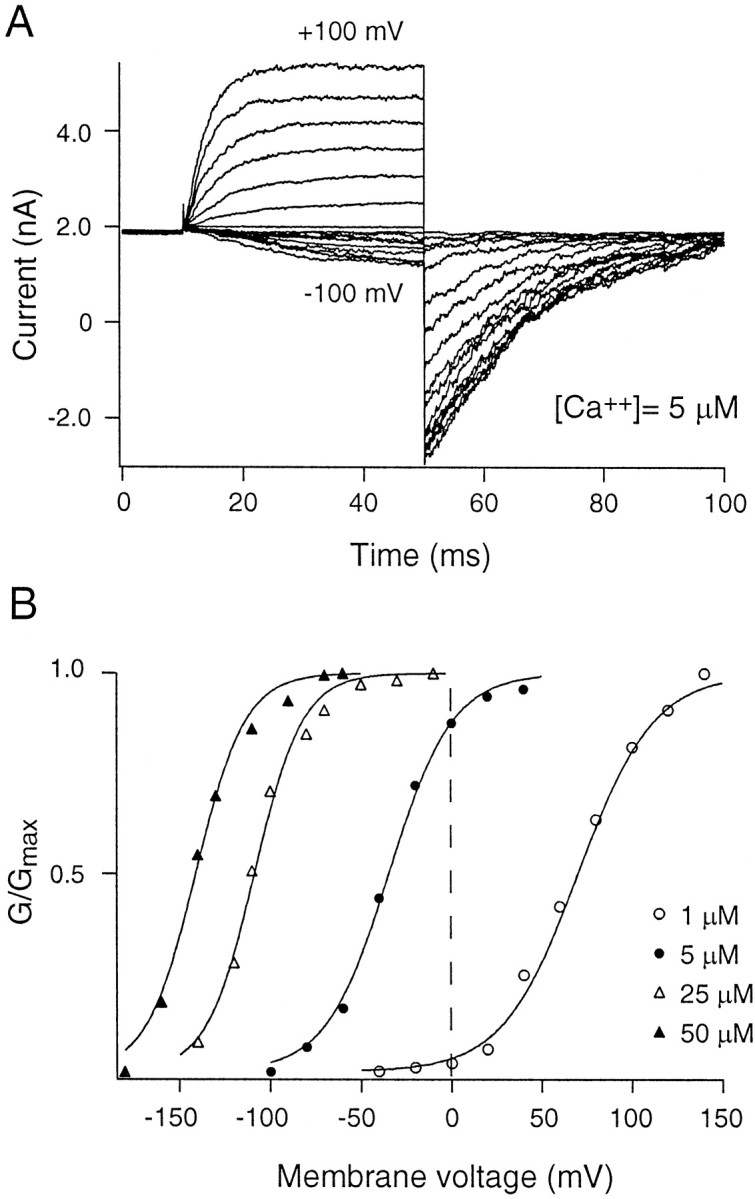
Fig. 4.

Gating of α0β channels. Patches containing BK channels formed by co-expressing both α0and β (henceforth referred to as α0β) were subject to voltage protocols as in Figure 3. A, Currents across the patch exposed to 5 μm Ca2+ for activation voltages ranging from −100 to +100 mV (steps of 10 mV). Tail currents were measured at −100 mV. B,G–V relationships obtained at four different calcium concentrations (1, 5, 25, and 50 μm) were fit with Boltzmann functions described in Equation 1. Notice that α0β activates at more negative voltages than does α alone, and increasing the calcium concentration causes a greater leftward shift in the activation curve for α0β.
