
Fig. 9.
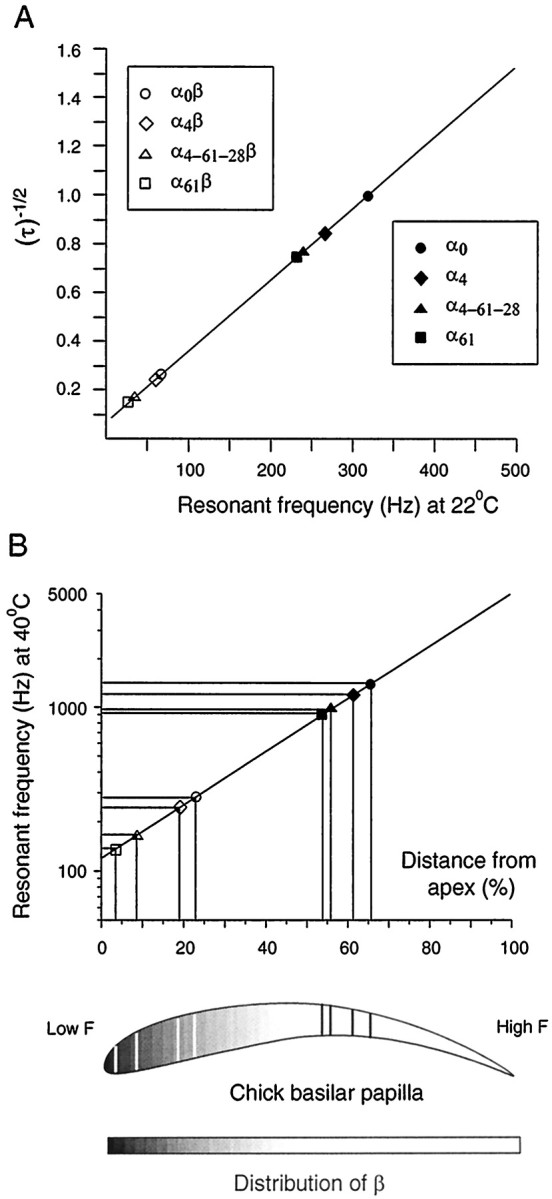
Estimated tuning frequencies and cochlear position for each of eight BK channel variants. A, Thestraight line redrawn from Wu et al. (1995) shows the relation between ensemble average single BK channel deactivation time constants and resonant frequency in turtle hair cells. Deactivation time constants for eight channel variants (measured at 4 μm calcium and −50 mV membrane potential) were overlaid to extrapolate a predicted frequency of tuning. B, Tuning frequency as a function of position along the cochlear axis [from Jones and Jones (1995)]. The resonant frequencies estimated from A were corrected for the body temperature of the chick (40°C) using a Q10 value of 2. The corrected frequencies were then mapped to a tonotopic position in the cochlea. The predicted positions are projected as linesacross the schematic of the chick basilar papilla (below). The decreasing shade of grayfrom the cochlear apex is indicative of expression levels of β along the tonotopic axis based on results from in situhybridization (Ramanathan et al., 1999).