Fig. 8.

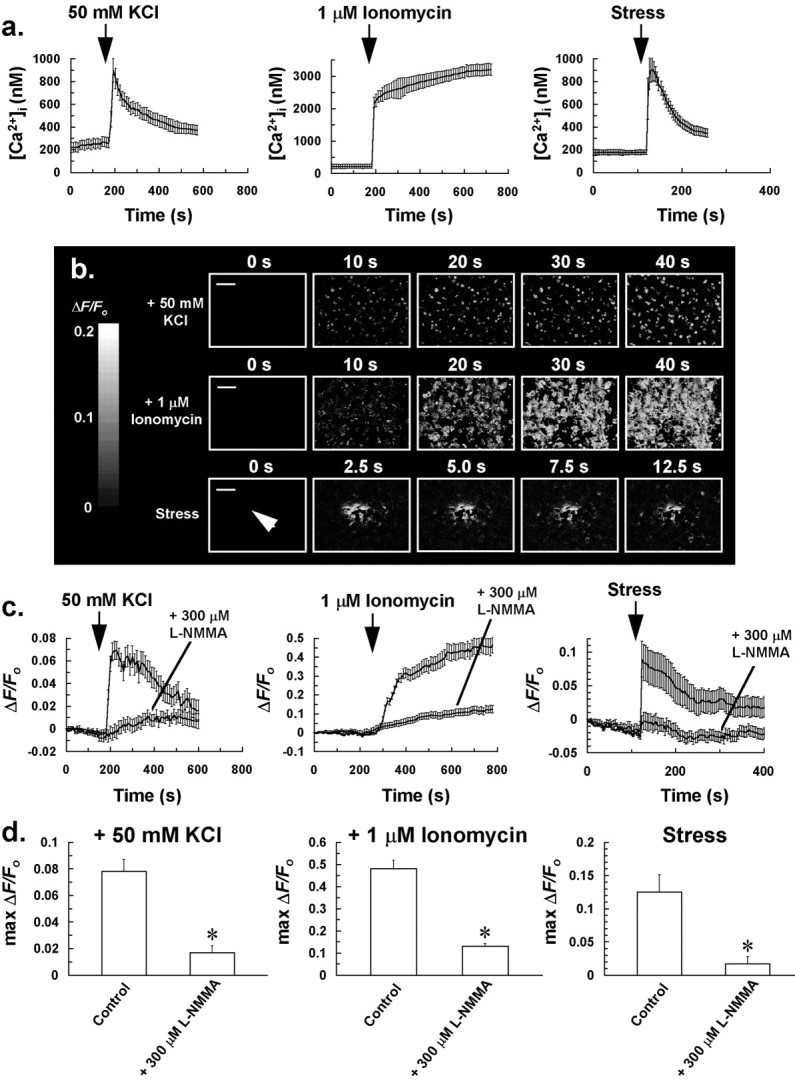
Evidence that mechanical stress and treatments that induce an increase in [Ca2+]iindependently of cell surface receptor activation are coupled to an increase in NO production in glia. a, Increase in [Ca2+]i of glial cells to 50 mm KCl, 1 μm ionomycin, or mechanical stress of a single glial cell. [Ca2+]i of at least 25 responding glial cells (for the stress response, chosen cells were the closest to the mechanically stressed target cell) was averaged for individual experiments. Traces in a represent the mean of these averaged responses from at least four separate experiments for each of the above treatments, with error bars indicating SD. b, Sequences of ratio images (ΔF/Fo) showing an increase in DAF-2 fluorescence in cells after bolus addition of 50 mm KCl or 1 μm ionomycin to the incubation bath, or mechanical stress of a single glial cell (arrow) at t = 0 sec, indicating that these treatments induce an increase in cytosolic NO in cells. Fluorescence ratio image sequences of b are representative of at least four separate experiments for each of the above treatments. Scale bars, 50 μm. c,ΔF/Fo of at least 25 glial cells (for the stress response, chosen cells were the closest to the mechanically stressed target cell) was averaged for individual experiments of b. Traces in c represent the mean of these averaged responses from at least four separate experiments for each of the above treatments, with error bars indicating SD. Pretreatment of cells for 30 min with l-NMMA inhibited the rise in cytosolic NO to the above treatments (c, d). d, Graphs derived from the experiments ofc, showing a reduction in NO production to 50 mm KCl, 1 μm ionomycin, and mechanical stress of a single glial cell, after pretreatment of cells with 300 μml-NMMA for 30 min. The maximum ΔF/Fo value of at least 25 glial cells (for the stress response, chosen cells were the closest to the mechanically stressed target cell) was averaged for individual experiments, with bars in d representing the mean of these averaged parameters ± SD from at least four separate experiments (*p < 0.05 vs control value).
