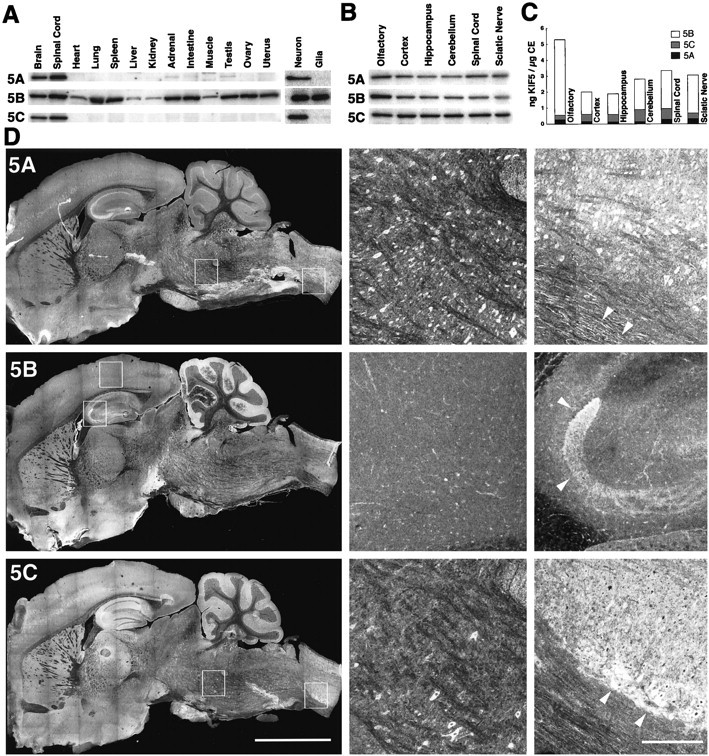
Fig. 2.

KIF5A and KIF5C are neuronal kinesins but showed differential distribution in the nervous system.A, Left, Tissue distribution of the three KIF5s by immunoblotting. KIF5B was detected in every tissue investigated, whereas KIF5A and KIF5C were expressed exclusively in the tissues of nervous system (Brain, Spinal Cord). A, Right, Immunoblot of cultured hippocampal neurons (Neuron) and glial cells (Glia). KIF5B was expressed in both neurons and glial cells, whereas the expression of KIF5A and KIF5C was limited to neurons and was not found in glial cells. B, C, Expression of the three KIF5s in nervous system as determined by quantitative immunoblotting. The olfactory bulb, cortex, hippocampus, cerebellum, spinal cord, and sciatic nerve were investigated. KIF5B was the most abundantly expressed KIF5 throughout the nervous system (70–90% of the total KIF5). As for the neuronal KIF5s, the expression ratio of KIF5C to KIF5A varied from one to five among different regions of the nervous system. Note the prominent expression of KIF5B in the olfactory bulb. D, Distribution of each of the KIF5s in the brain as shown by immunofluorescence analysis using anti-KIF5 antibodies (left, low magnification;middle and right, high magnification of the boxed areas in the left panels).5A, KIF5A stained various kinds of neurons. It was found in cell bodies, dendrites, and axons. Arrowheads in theright panel indicate the axons in the anterior funiculus of the spinal cord. 5B, Although KIF5B was highly expressed in the mossy fibers of the hippocampus (arrowheads in the right panel), anti-KIF5B antibody primary stained glial cells (e.g., astroglias in cortex; middle panel). 5C, KIF5C was expressed only in the subpopulation of neurons, especially in medulla (middle panel) and spinal cord (right panel). In spinal cord, KIF5C was highly expressed in the neurons located at the anterior horn (arrowheads). Note the tendency of a similar staining pattern in the cortex, hippocampus, cerebellum, and spinal cord to the immunoblotting data. Scale bars: left, 5 mm;middle, right, 0.5 mm.
