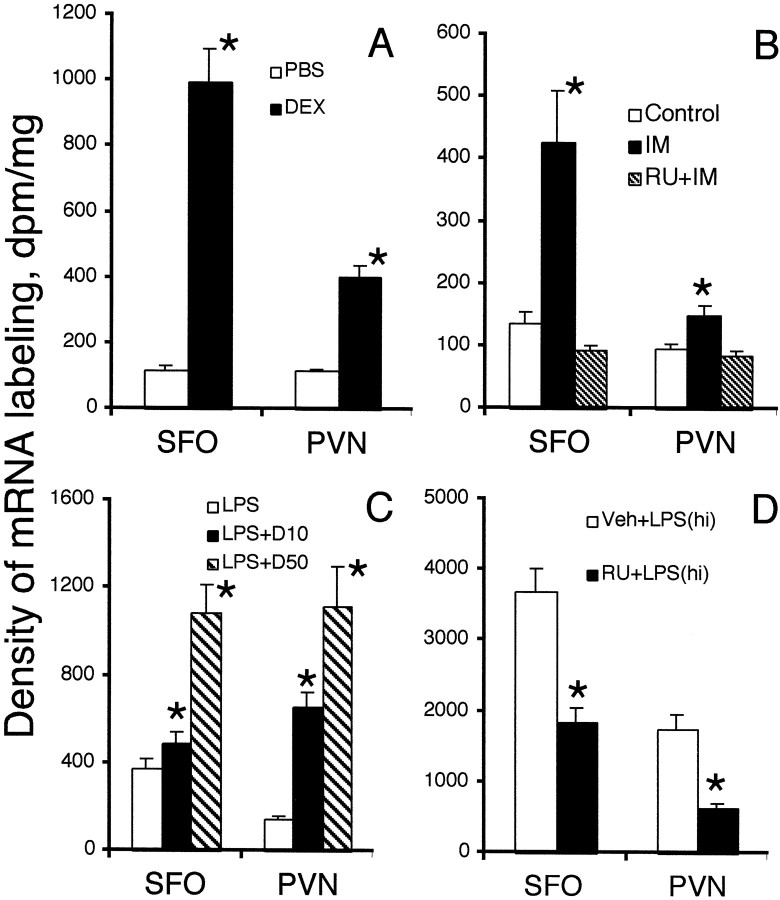
Fig. 5.
Means and SEMs of mRNA levels for IκBα in the SFO and PVN from experiments 1–4 (see Figs. 1-4) are shown [n = 4; *,p < 0.05 by t test; comparisons were made between experimental groups and control groups (open bars in each graph)]. Veh, Vehicle.

