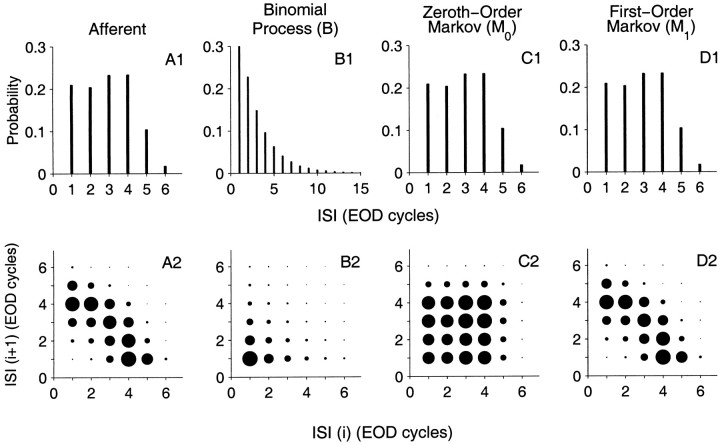
Fig. 5.
ISI histogram and joint interval histogram of the afferent spike train shown in Figure 1 (column A) and surrogate spike trains obtained from the afferent data (columnsB–D). A1–D1, Show the first-order ISI histograms I1(j), and A2–D2 show the joint interval histogram I(j1, j2) of adjacent ISIs. Size of thecircle is proportional to joint probability. B, The binomial spike train matches the mean ISI 1, but it does not match either the ISI or joint ISI distributions. C, The zeroth-order Markov spike train (M0) matches only ISI, but not the joint interval distribution. D, The first-order Markov spike train (M1) matches both the ISI and joint ISI of the afferent spike train. ISI sequences for B and M0 are renewal processes, whereas M1 is a nonrenewal process.

