Fig. 4.
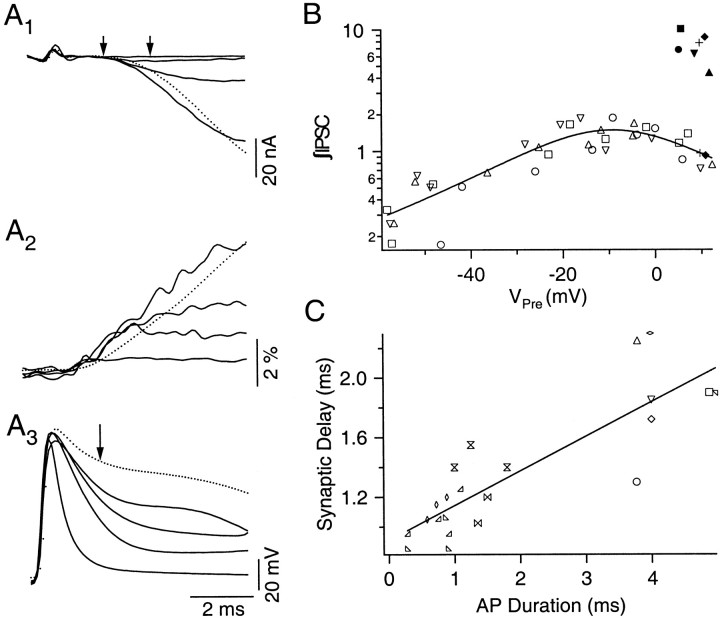
Systematic changes in the IPSC time course and synaptic delay as the duration of action potential increases.A1, A2, andA3 illustrate a series of IPSCs, Ca2+ transients, and action potentials recorded simultaneously as the block of K+ channels becomes more pronounced. The dotted traces represent responses activated by the broadest action potential. The Ca2+transient and IPSC elicited by the broadest action potential exhibit the slowest initial rate of rise. The double arrows inA1 define the time window within which the integral of IPSC was calculated (∫IPSC). The arrow inA3 identifies the point at which presynaptic membrane potential was measured, 1.5 msec after the peak (Vpre). Each tracerepresents the average of 100 trials. B, A depolarization–release coupling plot obtained by plotting ∫IPSC against Vpre. Results measured from the preparation shown in A are in open circles. Three additional preparations are also shown using different symbols. ∫IPSCs calculated in each preparation were normalized by scaling their averaged values to 1. Facilitated ∫IPSCs, shown as filled symbols, were then scaled according to their corresponding control ≥IPSCs. Two of the preparations (filled diamonds, plus signs) only include data obtained with the broadest action potentials. In these cases, their control ∫IPSCs were scaled to fall on the smooth curve, which is drawn by hand.C, A systematic increase in synaptic delay as the duration of presynaptic action potential increases. Action potential duration was measured at 0 mV (see Results for the measurement of synaptic delay). Results obtained from different preparations are shown using different symbols. Action potential duration ranging from 2 to 3.5 msec is not available because action potentials broaden in a large step as Ca2+ spikes appear.

