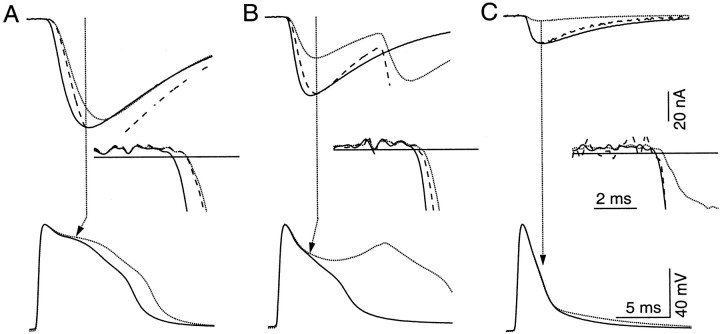
Fig. 5.
A reduction in synaptic delay during F2 facilitation. Traces in A–C were recorded in 20, 4, and 1 mm TEA, respectively (1 mm 4-AP was present during all recordings). Control (dotted lines) and test (solid lines) action potentials are shown in the bottom panels, and control and facilitated IPSC with matching trace stylesare shown in the top panels. Insetsenlarge the area in which IPSCs start to deviate from baseline. Thehorizontal lines in the insets represent the 5 SD level at which the synaptic delay is measured. Broken traces in the inset represent control IPSCs after they have been scaled (see Results and Fig. 6 for details of scaling). There is a significant increase in the difference between the synaptic delays of control and facilitated IPSCs as the duration of action potential is increased. This trend is consistent regardless of whether the control IPSC is scaled or not. To examine changes in synaptic delay under comparable levels of synaptic facilitation as the duration of action potentials varied, 1 (A), 7 (B), and 13 (C) conditioning action potentials were elicited to activate a relatively constant peak amplitude of fluorescence transients, 15, 22, and 18% respectively. The broad second peak of the control action potential inB was attributable to the average of jittering second spikes. Traces in all panels represent the average of 120 trials.

