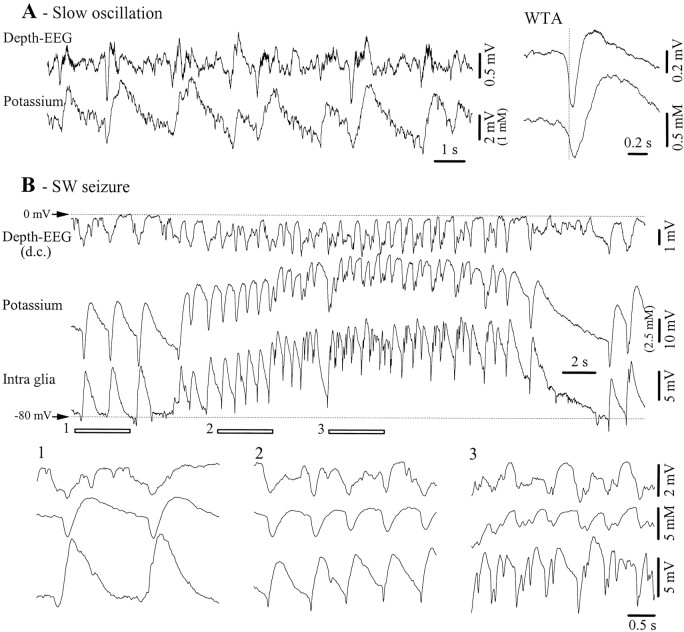
Fig. 12.
Potassium activities related to the slow oscillations and SW seizures. A, Depth-EEG and K+ variations during a period with slow (<1 Hz) oscillations. The right panel depicts WTAs (n = 40) from the two leads. The WTAs were triggered with the steepest descending slope of the field potential (vertical dotted line). B, SW seizure recorded with a double-barrel pipette (Depth-EEG andPotassium) and with an intracellular microelectrode (Intra glia). In this panel, field potentials were not subtracted from the K+-sensitive or intraglial potentials because field and glial activities were time-lagged and because negative K+ potentials were more ample than their field equivalents. The three underlined epochs are expanded below and display two interictal PDSs (1), ictal PDSs during the initial part (2), and the middle of the seizure (3).

