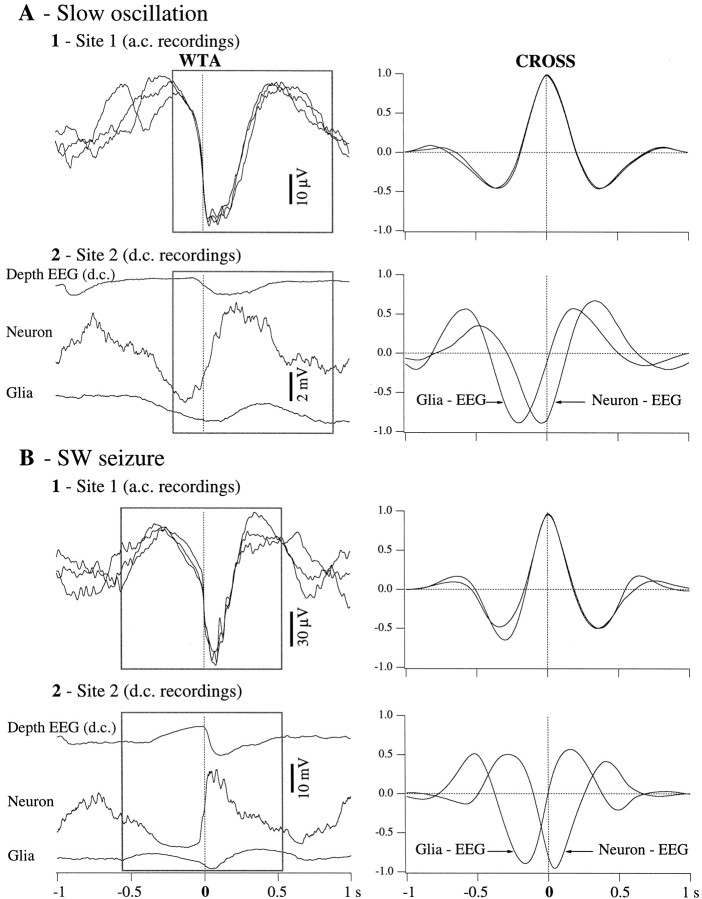
Fig. 4.
WTAs and correlative analyses for the activities presented in Figure 3. WTAs were triggered with the sharpest negative slope of the K-complex (A) and of the EEG spike (B) in the a.c. trace (Site 1, left panels). The triggering point is indicated by thevertical dotted lines. Two situations were analyzed: slow-wave sleep activities (A) and SW seizures (B). The three traces displayed in each left panel correspond to one of the three recording configurations described in the previous figure. The WTA traces recorded at Site 1 were superimposed to reveal a 1 sec epoch (in the square) in which their superimposition was optimal (see cross-correlations at right with correlative peaks >95%). The same 1 sec epoch was then used to calculate cross-correlations between the respective traces recorded atSite 2. These cross-correlations show roughly that during both slow oscillations and SW seizures, extracellular potentials reflect reverted intraglial and/or intraneuronal potentials. They also disclose time relationships between intracellular and extracellular potentials within cells separated by <10 μm.

