Fig. 7.
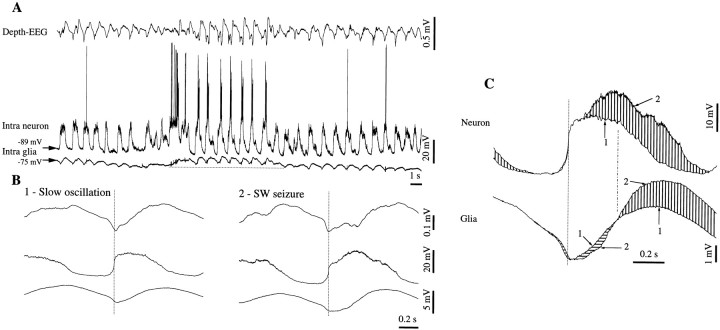
Glial transient negative potentials appear mostly during epileptiform activities. Double intracellular recording (neuron–glia) in association with area 5. A, Short SW seizure evolving from a slow oscillation pattern. The epileptic episode is accompanied in the glia recording by a persistent depolarization (above the horizontal dotted line). B, WTAs from the slow oscillation (1) and from the SW seizure (2) triggered with the steepest positive slope of the neuron (vertical dotted line). Note the additional depolarizing peak over the depolarization of the neuron in B2 and the corresponding negative potential superimposed on the glial potential. C, Superimposition of the neuronal and glial WTAs, from A andB, respectively. Traces marked with 1 are from the slow oscillation WTA; those with marked with 2are from the SW seizure. Vertical lines point to the excess of depolarization, and horizontal lines mark hyperpolarization during the seizure as compared with the slow oscillation activity.

