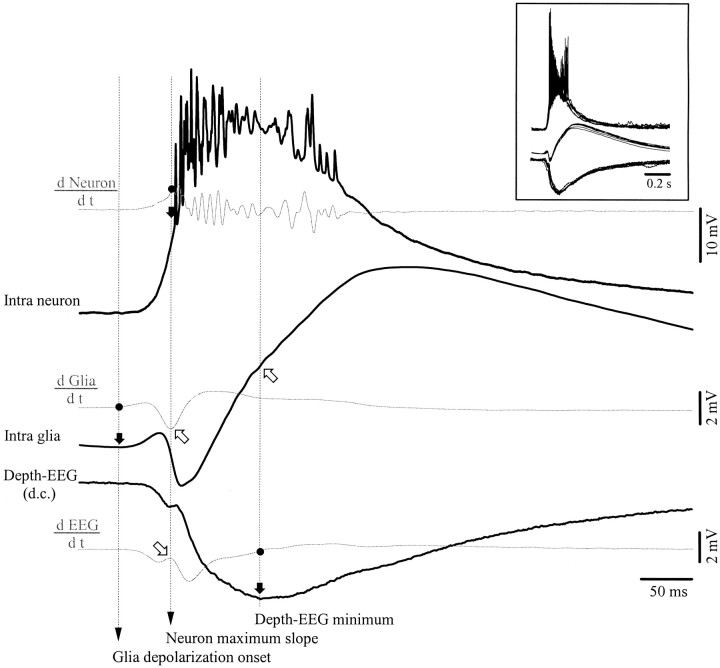
Fig. 8.
Evidence that the glial transient negativities reflect neuronal depolarizations. Shown are simultaneous intracellular recordings of neuronal and glial activities, together with d.c. extracellular field potentials. Black traces represent WTAs (n = 50) of rhythmic PDSs. The threegray traces are derivatives (d/dt) of the respective potentials. Several points (black dots) were marked on the three derivatives: the onset of the glial depolarization at the point where its derivative becomes positive, the maximum of the neuronal derivative coinciding with the maximum slope of the neuronal depolarization, and the minimum of the depth-EEG at the moment where the field derivative is zero. A black arrow and avertical dotted line mark the correspondence of these points with the associated potential in each trace. Open arrows point toward the coincidence with particular shapes: the maximum slope at the onset of the neuronal depolarization coincides with the maximum negative slope at the onset of the corresponding glial negativity (top arrow) and with a dicrotic swing in the EEG (bottom arrow). The EEG minimum is associated with the change in slope of the glial depolarization. Also note that the glial depolarization starts before the neuronal depolarization.

