
Fig. 5.
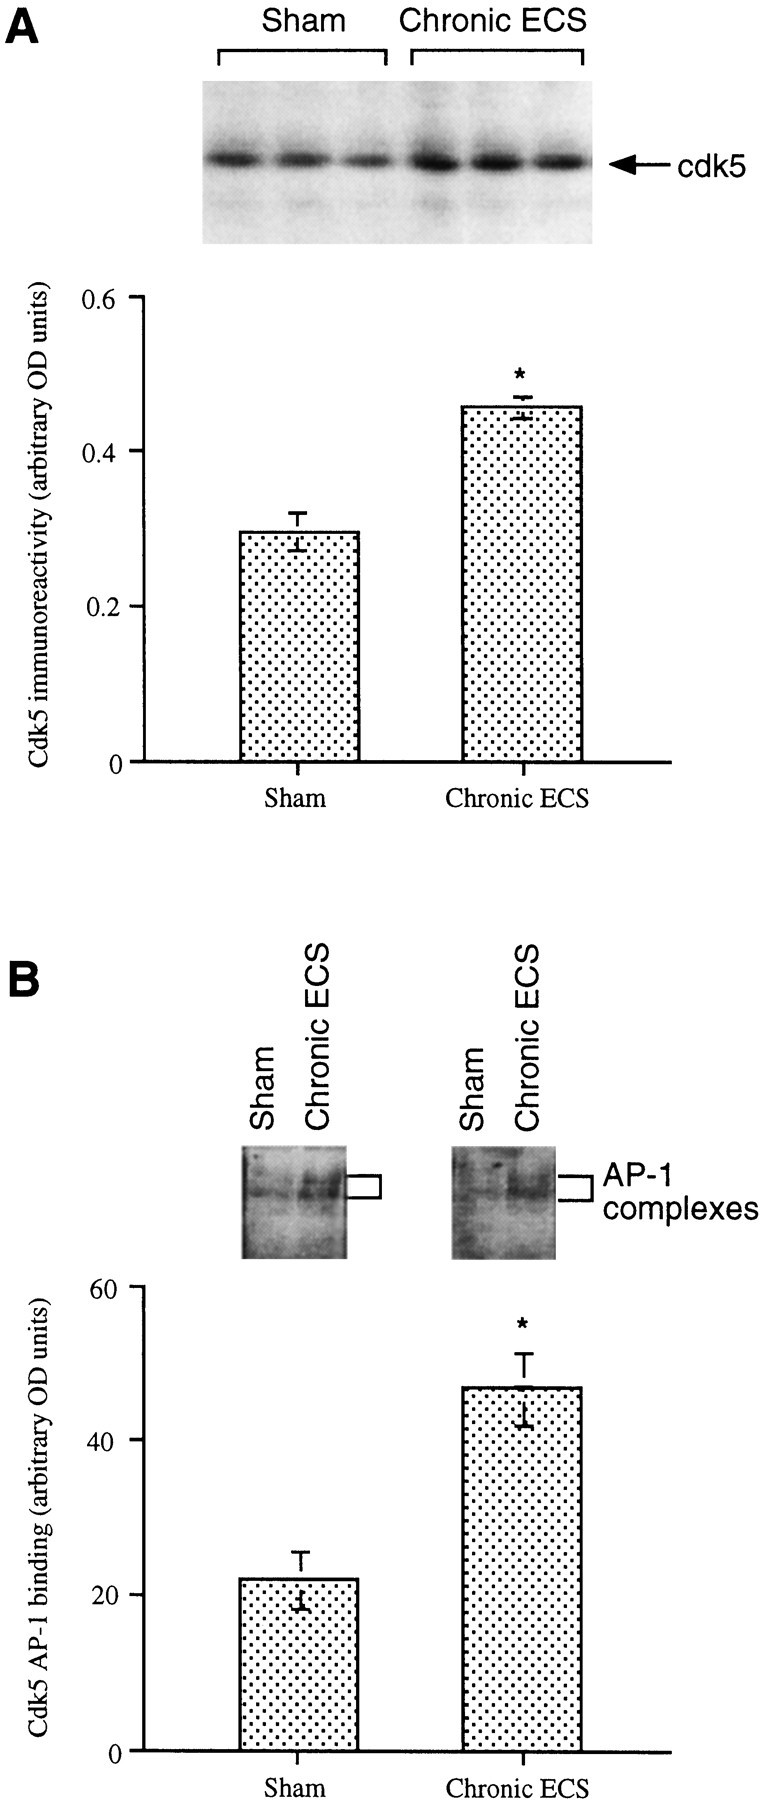
Upregulation of cdk5 immunoreactivity in rat hippocampus by chronic ECS treatment. A,Top, A representative immunoblot shows cdk5 levels in the hippocampus after sham or ECS treatment. Bottom, Levels of cdk5 immunoreactivity are given as arbitrary OD units and are expressed as the mean ± SEM (n = 8 animals in each treatment group). B, Top, A representative autoradiogram shows cdk5 AP-1-binding activity after sham or ECS treatment. Bottom, Levels of cdk5 AP-1-binding activity are given as arbitrary OD units and are expressed as the mean ± SEM (n = 8 animals in each treatment group). *p < 0.05 by Student'st test.