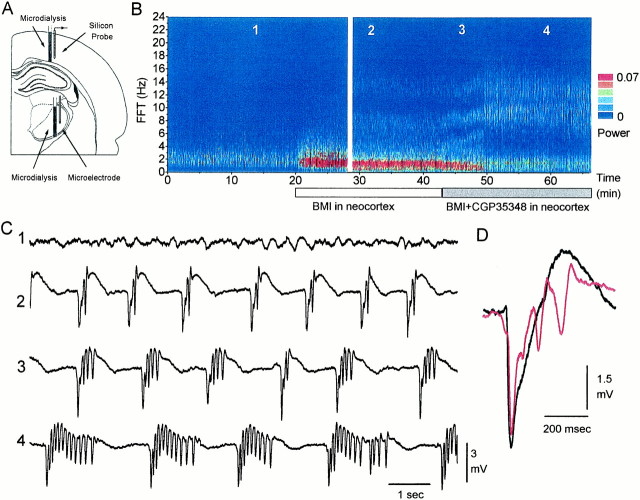
Fig. 1.
Effect of blocking neocortical GABAAreceptors on neocortical field potential activity. A, Schematic diagram depicting the locations of the microdialysis probes used to infuse drugs into the neocortex and thalamus, of the 16-site linear array silicon probe used to record activity from the neocortex, and of the microelectrode used to record activity from the thalamus. The silicon probe was located 3 mm more anterior than the microdialysis probe, but for simplicity, they are shown in the same section.B, Power spectrum derived from every 2 sec of spontaneous field potential activity recorded from the neocortex and displayed as a color contour plot. During infusion of ACSF through the microdialysis probe, neocortical activity consists of slow-wave activity. Infusion of a GABAA receptor antagonist (BMI) into the neocortex results in the generation of ∼1 Hz discharges. Further application of a GABAB receptor antagonist (CGP35348) slows these discharges to ∼0.5 Hz and enhances their duration, giving rise to ∼10 Hz oscillations. The gap at minute 28 represents 15 min. C, Examples of recordings before, during BMI, and during BMI plus CGP35348 application. Thenumbers on the traces correspond to the times indicated in B. Recordings were from a site 1 mm in depth from the surface. Traces are 10 sec long.D, Electrographic pattern of the ∼1 Hz discharges induced in the neocortex by BMI alone, which may consist of a negative spike followed by a positive wave or of a negative spike followed by one to three lower amplitude negative spikes that ride on the wave.

