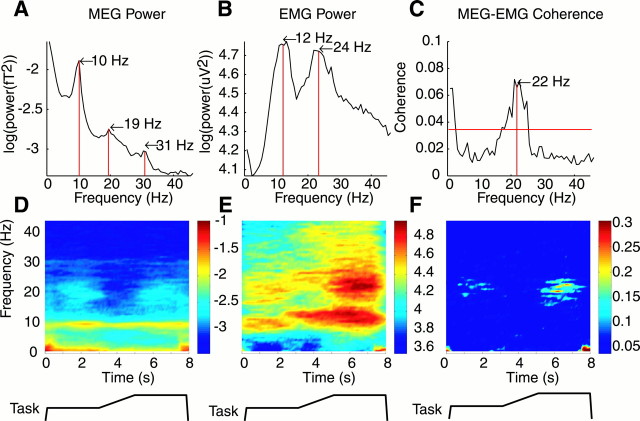
Fig. 2.
Single subject data for the COMP1 condition.A, B, Power spectra for MEG signal (A) recorded from a sensor overlying the sensorimotor cortex and the EMG recorded from the 1DI muscle (B), averaged over the whole task and for all trials (n = 75). C, The coherence spectra calculated between the two power spectra shown inA and B. The red lineindicates the 95% significance level. D,E, Frequency versus time power spectra maps for MEG and 1DI EMG activity calculated with respect to the task;below each trace is a schematic of the task.F, Maps of MEG–EMG coherence frequency calculated for the different periods of the precision grip task. The color bar indicates the level of coherence estimated; only values above the 95% significance level are shown. The frequency scale on the ordinate inD applies also to plots E andF.

