
Fig. 3.
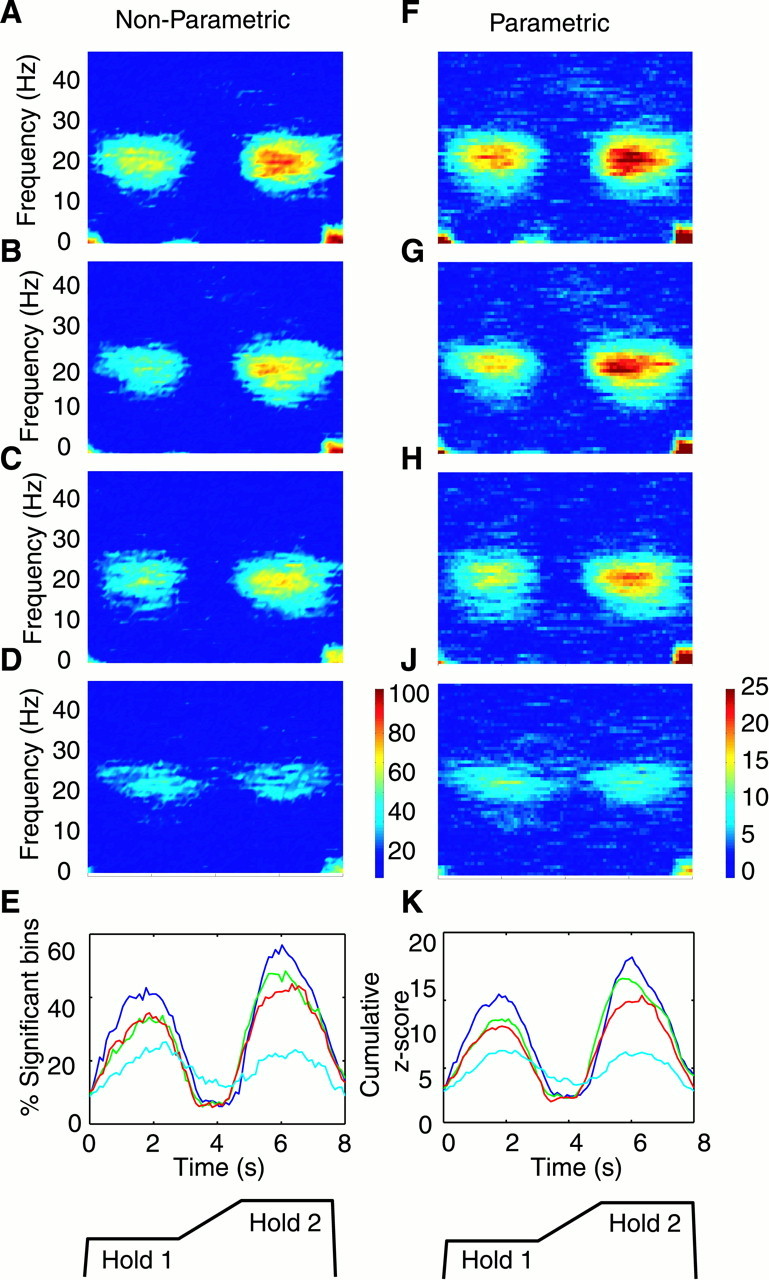
Effect of task condition on MEG–EMG coherence.A–D, Coherence frequency versus time maps. Thecolors indicate the percentage of points above significance pooled using the nonparametric method (see Materials and Methods) for data from all nine subjects and four muscles (see color scale bar to the right of D). At any point, 100% would be equal to 36 of 36 points. The levers were most compliant in A (greatest digit displacement required to exert the target force level), and compliance was reduced in the following direction: A, COMP1; B, COMP2;C, COMP3; and D, ISO (no lever movement).E shows the mean percentage of significant points in the 15–30 Hz range for each of the four task conditions with respect to the task (dark blue, COMP1; green, COMP2;red, COMP3; and light blue, ISO). Data for each of these traces were averaged across trials, across muscles, and across subjects. F–K show the same data combined using the parametric method. Below eachcolumn is a schematic of the task.