
Fig. 2.
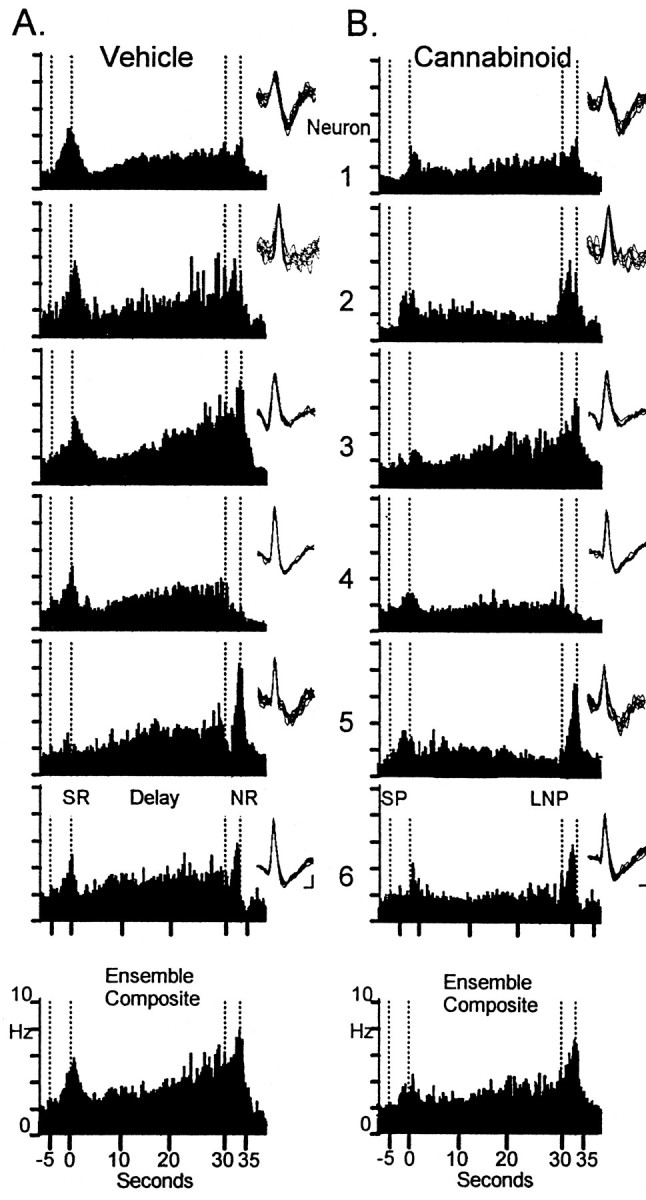
Simultaneously recorded hippocampal neuron firing during vehicle and cannabinoid sessions. Neurons 1–3were simultaneously recorded from CA3, and neurons 4–6were recorded from CA1. Trial-based histograms (TBHs) depict averaged firing rates of each neuron on 30 sec delay trials (n > 75 trials). the ensemble composite at thebottom reflects the average across all six neurons.A, TBHs representing firing in control session.B, TBHs recorded in WIN-2 (0.35 mg/kg) session. Waveforminsets show the individual action potential waveforms used to discriminate these neurons during recording and indicate that the same neurons were recorded in both conditions. SP, Sample presentation; SR, sample response;LNP, last nose poke during the delay; NR, nonmatch response. Firing rate scale (Hz) is shown on the ensemble composites. Calibration: 15 msec, 25 μV.