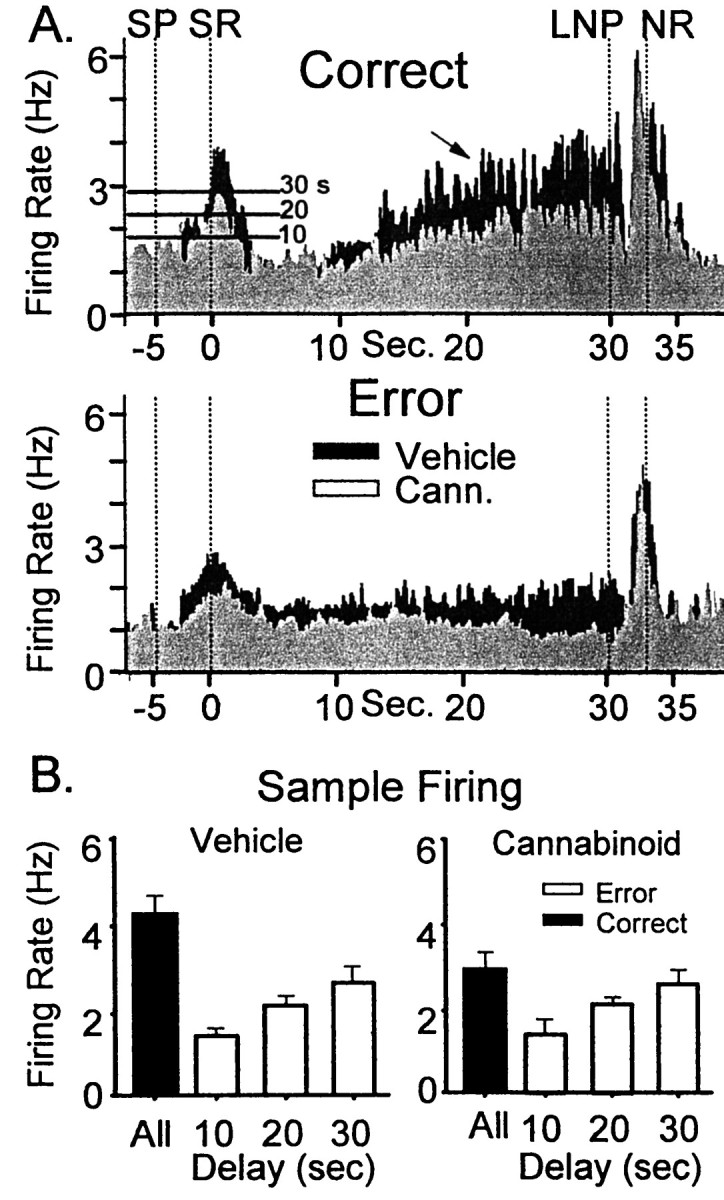
Fig. 4.

Effects of cannabinoids on correct and error DNMS trials. A, Black TBHs depict ensemble composite firing in control sessions; light gray TBHs depict ensemble firing in WIN-2 (0.35 mg/kg) sessions. Firing on correct DNMS trials is shown above (Correct); firing on error trials is shown below (Error). Thearrow indicates the typical ramped increase in firing during the delay phase on correct trials that is absent on error trials. SP, Sample presentation; SR, Sample response; LNP, last nosepoke; NR, Nonmatch response. Horizontal lines on histograms at SR indicate minimum peak firing rate for correct performance at the indicated delay. B, Strength of SR encoding depicted by ensemble firing. Bar graphs depict mean SR peak firing rates over all correct trials (black bars) compared with the maximum firing rate seen on error trials (white bars) for vehicle (left) and cannabinoid (WIN-2 0.35 mg/kg, right) sessions. Trials were sorted according to length of delay (0–10, 11–20, and 21–30 sec).White bars reflect the maximum firing rate that resulted in an error for those delay categories. The distribution of maximum firing rates for error trials was not significantly different, although the overall mean firing rate for all correct trials was significantly reduced in cannabinoid sessions.
