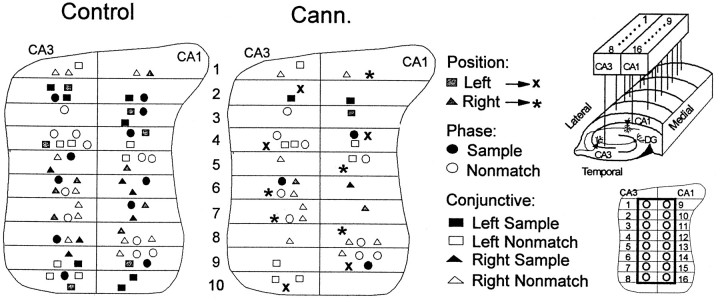
Fig. 7.
Anatomical distribution of hippocampal functional cell types. Neurons (n = 67 from 6 animals) were identified with respect to FCT and position on electrode recording array (top inset, right). the left paneldepicts the identified anatomical location of position cells, phase cells, and conjunctive cells on a fold-out map of hippocampus with wire placement in the array noted at 200 μm segments (bottom inset, right). Individual correlates are identified byshading and symbol coding as shown. Theright panel depicts the distribution of FCTs after exposure to WIN-2 (0.35 mg/kg; Cann.) Note the loss of black shaded cells that fired during the sample phase; ∗ and × indicate control right and left position cells, respectively, which did not fire during the Sample phase in cannabinoid sessions but continued to fire during the appropriate Nonmatch phase. Only three sample phase cells and three left or right sample conjunctive cells continued to respond in the WIN-2 (35 mg/kg) sessions. There was no significant change in the distribution of phase or conjunctive cells that fired in the nonmatch phase. Insets, top, Diagram of hippocampal recording array; bottom, placement of electrode recording sites on a fold-out map of hippocampus; pairs of electrodes were positioned in CA3 and CA1 at 200 μm intervals along longitudinal axis of hippocampus. See Hampson et al. (1999b) for details of alignment of ensembles.

