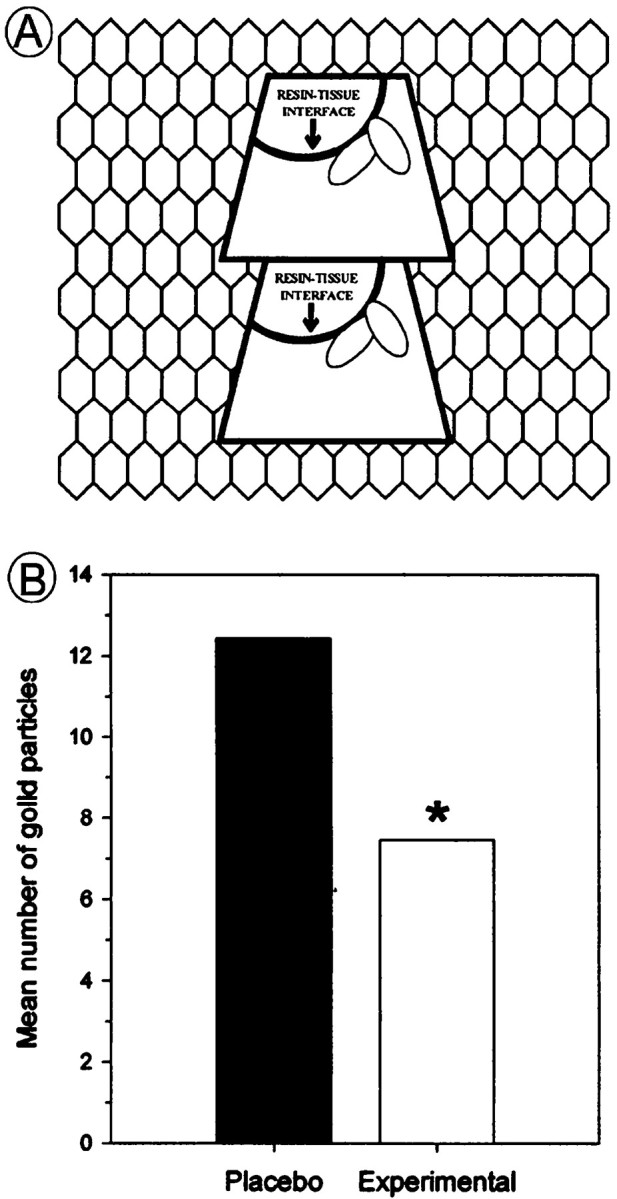
Fig. 3.

Schematic illustration showing results obtained from quantitative analysis of electron microscopic data.A, Schematic depiction of a copper grid containing a ribbon of sections obtained from 70-nm-thick ultrathin sections.Trapezoids included the LC/peri-LC areas from placebo- and morphine-treated rats. Sections were collected in serial order from the face of the block. Only sections containing the tissue/plastic (resin) interface were included in the analysis so that the results were not thwarted by variations in immunocytochemical labeling based on distances from the surface of the blockface. B, Bar graph showing that ENK-labeled axon terminals from the LC of morphine-treated rats exhibited fewer gold–silver particles as compared with ENK-labeled axon terminals analyzed from placebo-treated rats.
