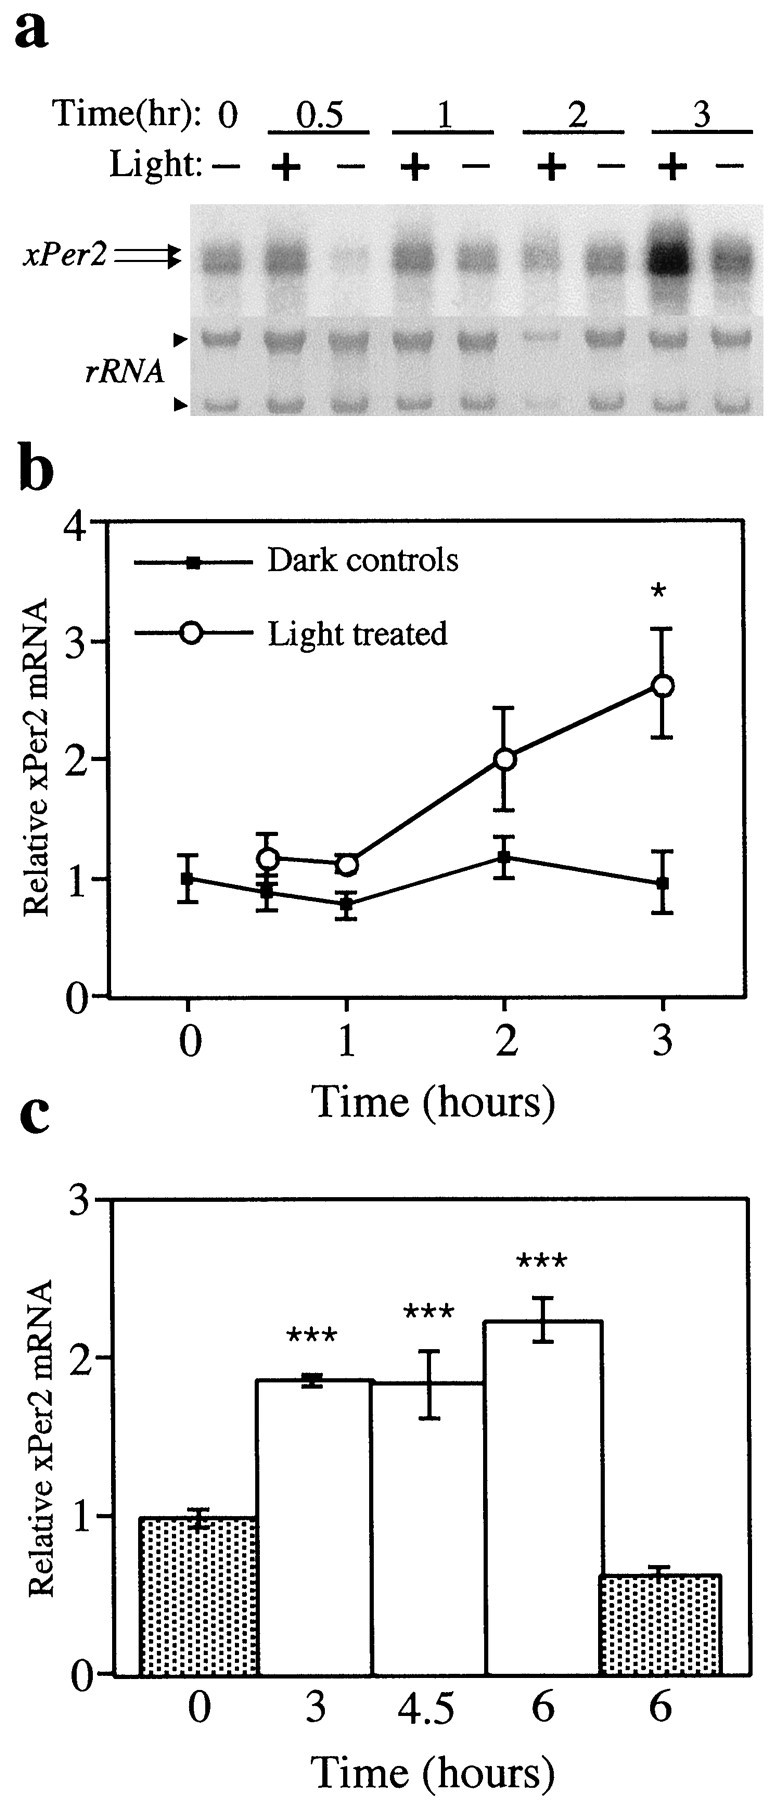
Fig. 2.

Three hours of light increase xPer2mRNA in vitro. Eyecups were dissected the afternoon before the experiment and were cultured in constant darkness until a continuous light pulse (3–5 × 10⁻⁴W/cm2) was delivered at either ZT 18 (a, b) or ZT 2 (c). a, Top,xPer2 mRNA for all experiments was measured by Northern blotting. Each lane contains the total RNA from a single retina of an individual animal. Two xPer2 bands (arrows) at 10 and 13 kb were increased after 3 hr of light. Both bands were quantitated in all experiments.Bottom, The abundance of the ribosomal RNA (arrowheads) was visualized by methylene blue staining of the blot. b, One eyecup from each animal received light (white circles), and the paired eyecup from the same animal was maintained in darkness (black squares). Retinas were collected at 0, 0.5, 1, 2, or 3 hr after the beginning of the light pulse. The abundance of xPer2 mRNA was quantitated by Northern blotting, and the xPer2 signal was normalized to the signal of an internal control (GAPDH) for each individual retina. Mean values (4–5 retinas from individual animals) for each group were normalized to the 0 hr dark control. The 3 hr light-treated group was significantly different from the 3 hr dark group (*p < 0.05, ANOVA). No significant differences were detected between any of the dark control groups (ANOVA). c, Retinas were collected after 3, 4.5, or 6 hr of light (white bars) or after 0 or 6 hr of dark (gray bars). The abundance ofxPer2 mRNA was quantitated by Northern blotting, and thexPer2 signal was normalized to the signal of an internal control (actin) for each individual retina. Mean values (4–5 retinas from individual animals) for each group were normalized to the 0 hr dark control. The light groups were significantly different from both the 0 and 6 hr dark controls (***p < 0.001, ANOVA). No significant difference was detected between the 0 and 6 hr dark groups (ANOVA).
