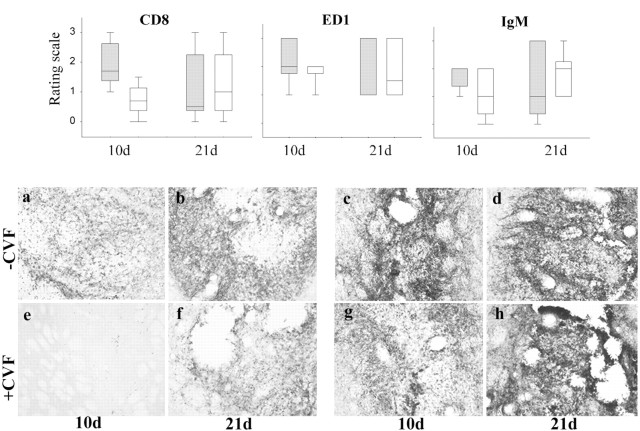
Fig. 6.
The relative infiltration of CD8-positive cells, ED1-positive macrophages/microglia, and IgM binding at days 10 and 21 after implantation in animals receiving CVF compared with those that received none. There is a significant lack of CD8-positive cells at 10 d in those animals treated with CVF, and although ED1-positive cells showed a similar pattern, this did not reach statistical significance. By 21 d there was no difference between those animals receiving and not receiving CVF. With respect to IgM, although there is a slight tendency for less IgM binding in those animals receiving CVF, this was a marginal effect and less than that seen for the cellular infiltration and microglia/macrophage activation response. The boxed plot represents the median value and 75% confidence limits, with the bars representing 95% confidence limits for the data. Gray, No CVF; white, CVF.a–h, CD8 and ED1 staining of xenografts with and without CVF treatment. a, Ten-day-old xenografts contain a dense CD8 infiltrate that is also (b) seen at day 21 after implantation.c, ED1 staining of 10-d-old xenografts shows a marked microglia reaction and/or macrophage infiltration in the graft, which (d) persists and is still clearly visible at day 21 after implantation. e, In contrast, animals receiving CVF have a greatly reduced CD8 infiltrate at 10 d after grafting, although (f) by day 21 the infiltrate is similar to that seen in the control, no CVF-treated animals.g, CVF-treated animals also had a less marked ED1 response at 10 d after grafting, although the reduction is less than that seen for CD8 staining. h, By day 21 the response is more marked and similar to that seen in the control, no CVF-treated animals.

