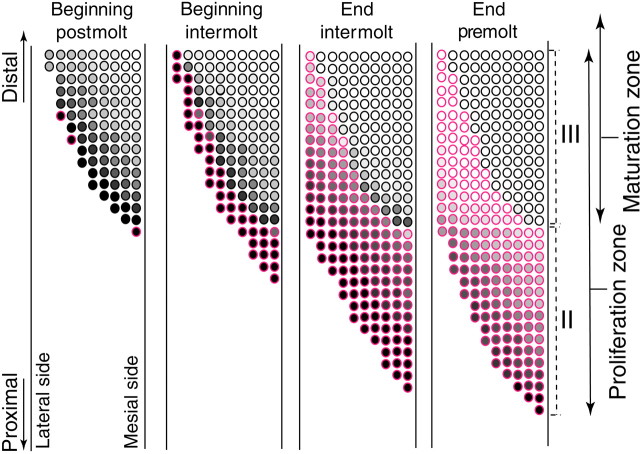
Fig. 10.
Schematic model of the spatiotemporal wave of differentiation and maturation of ORNs in clusters of developing aesthetascs (circles with red line) and newly emerged aesthetascs (circles with black line) throughout a molt cycle. Levels of grayswithin the circles indicate different levels of taurine-like IR in ORNs of a cluster; an empty circlesymbolizes a cluster for which no ORNs have taurine-like IR. ORNs from newly emerged aesthetascs, particularly those with high taurine-like IR, are also less likely to be odor responsive (see Fig. 11). Developmental zones (Fig. 5, II,III) are given on the rightside of the figure.

