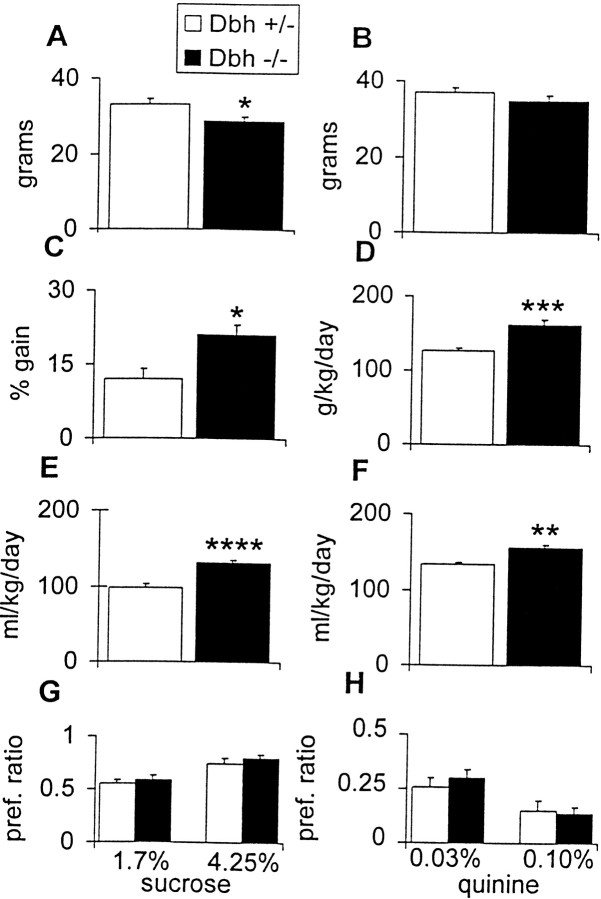
Fig. 4.
Body weight and consumption measurements during preference study. A, Body weight before start of preference study. B, Body weight after conclusion of preference study. C, Weight gain during preference study calculated as a percentage of starting weight. D, Average food consumption over course of preference study.E, Average water consumption over course of preference study. F, Average total fluid (water + ethanol) over course of preference study. G, Sucrose preference ratio (weight of sucrose solution consumed/weight of total fluid consumed).H, Quinine preference ratio (weight of quinine solution consumed/weight of total fluid consumed). *p < 0.05; **p < 0.01; ***p < 0.001; ****p < 0.0001.

