
Fig. 4.
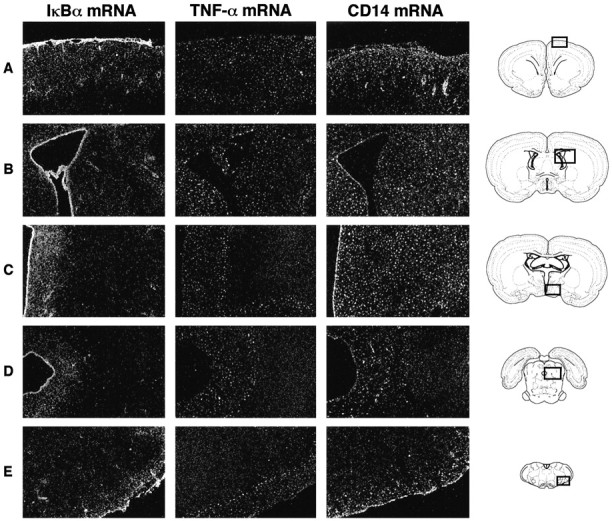
Comparative pattern of IκBα-, TNF-α-, and CD14-expressing cells in different areas of the rat brain in response to centrally injected TNF-α. These dark-field photomicrographs of nuclear emulsion-dipped sections show scattered small positive cells in the brain of rats killed 1 (IκBα), 3 (TNF-α), or 6 (CD14) hr after the intracerebroventricular infusion of the proinflammatory cytokine. These times correspond to the maximal expression levels of each transcript after the intracerebroventricular infusion.A, Leptomeninges and isocortex; B, ependymal lining cells and areas around the lateral ventricle;C, region of the third ventricle; D, central canal; E, the ventrolateral medulla. The schemes of the right column were taken from the atlas of Swanson (1992). Magnification, 10×.