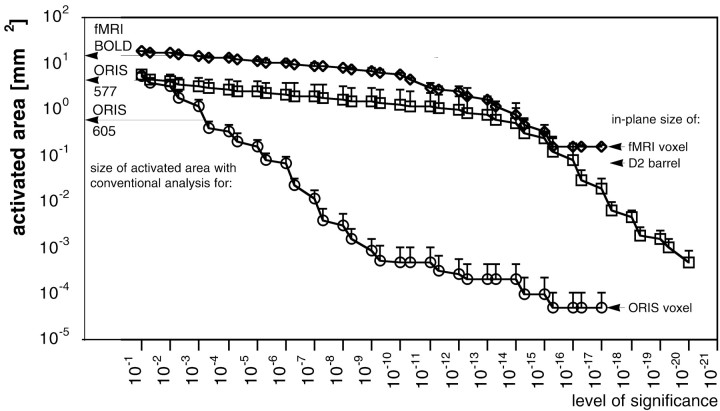
Fig. 3.
Size of the coherent areas over the barrel field activated by vibrissal stimulation plotted as a function of the level of significance of the Pearson's correlation coefficient for the fMRI BOLD signal and for the ORIS-577 and ORIS-605 signals. The data points represent the means (± SE) from the five animals. Note the rather parallel functions for the BOLD (diamonds) and the ORIS-577 signal (squares). For comparison, the sizes of the areas obtained with conventional analysis of fMRI and ORIS data (Masino et al., 1993; Chen-Bee et al., 1996), the in-plane size of fMRI and ORIS voxels, and the size of the D2 barrel in the gerbil are also identified. Note that the latter is smaller than the size of a single fMRI voxel.

