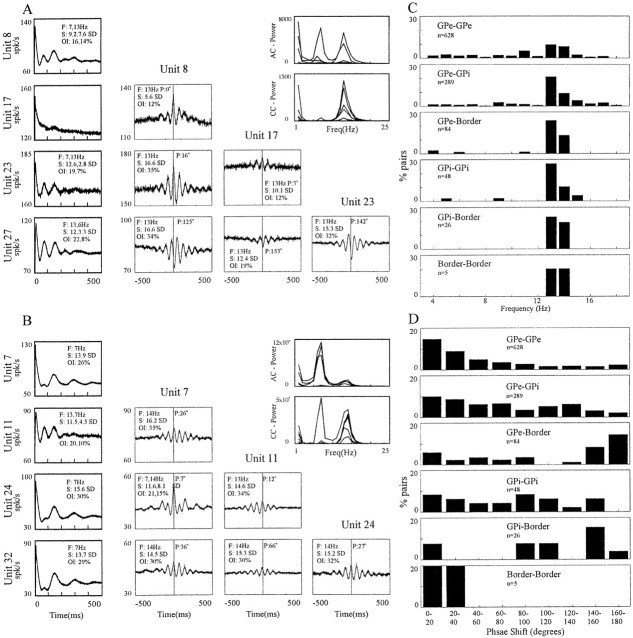
Fig. 15.
Cross-correlograms and their spectra in the MPTP-treated state. A, B, Auto- and cross-correlograms with power spectra of GP cells in MPTP-treated monkeys. All of the cross-correlograms have multiple significant peaks or troughs, and all of them have significant oscillations. Notice inA that cell 27 (Unit 27) is not in phase with all other cells, whereas in B all cells are phase-locked. In A, cells 8 (Unit 8) and 23 (Unit 23) were from GPe and cells 17 (Unit 17) and 27 (Unit 27) were from GPi. In B, all of the cells were from the GPe. Layout ofA and B is as in Fig. 12. Details characterizing the oscillations are given on the graph:F, frequency of oscillatory correlograms;p, phase shift in degrees; S, signal-to-noise ratio; OI, oscillation index. In cases with more than one significant peak, the details of the peaks appear in order of their strength; AC = autocorrelograms;CC = cross-correlograms. C, Distribution of the frequencies of oscillatory cross-correlograms in the MPTP-treated state. D, Distribution of the phase shifts of oscillatory cross-correlograms in the MPTP-treated state. InC and D the y-axis shows percentage of oscillatory correlograms of all the correlograms recorded from each combination of nuclei. The total number of pairs recorded from each nuclei pair is listed in thegraphs.

