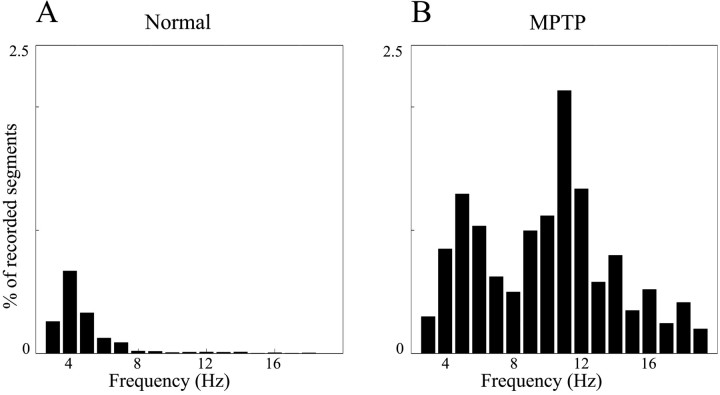
Fig. 3.
Distribution of the frequencies of significant peaks in the power spectra of segments of accelerometer recordings. Only peaks with SNR >3 SD are included. Segment duration was 2.56 sec. Data of both monkeys were lumped together. A, Distribution in the normal state, n = 79,761 segments. B, Distribution after MPTP treatment,n = 111,755 segments.

