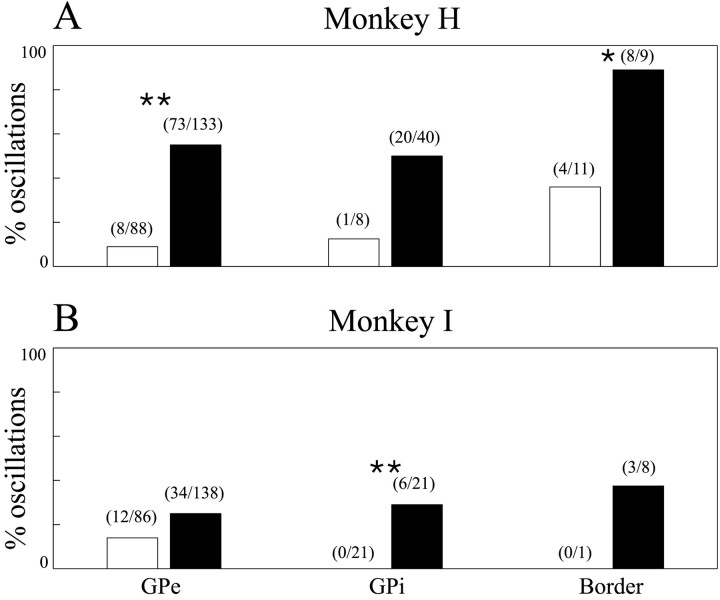
Fig. 7.
Percentage of oscillatory cells in the normal and parkinsonian state. A, Monkey H. B, Monkey I. Percentages of oscillatory cells are plotted asbars. Numbers of oscillatory cells of all recorded cells are given in brackets. Open bars are cells recorded in the normal state; black bars are after MPTP treatment. Left two bars are for GPe cells,middle two bars are for GPi cells, and right two bars for border cells. *Significant difference atp < 0.05, χ2 test. **Significant difference at p < 0.01, χ2test.

