
Fig. 5.
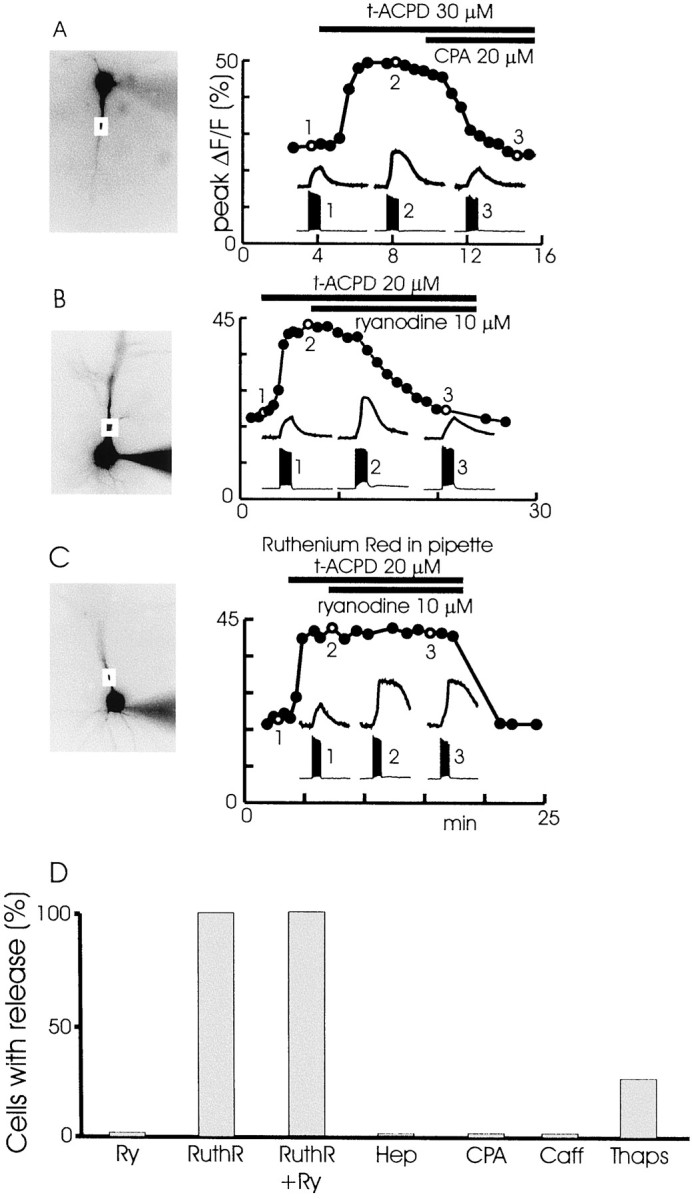
Effect of different pharmacological agents on spike-evoked release in the presence of 30 μmt-ACPD. A, CPA blocks release. Cell image, peak ΔF/F graph, and insets are similar to those shown in Figure 4. In normal ACSF a train of 20 backpropagating spikes evoked at 30 msec intervals caused a small [Ca2+]i increase linked in time to the spikes (1). When 30 μmt-ACPD was added to the bath, a larger increase was observed (2). Adding 20 μm CPA to the solution reduced the [Ca2+]iincrease to the level that was observed in control conditions (3). Each point on the graph represents a separate trial evoked at 30 sec intervals. Some points have been deleted because other protocols were tested at those times.B, A similar experiment showing that 10 μmryanodine added to the ACSF blocked the secondary [Ca2+]i increase. C, A similar experiment showing that 10 μm ryanodine did not block the secondary [Ca2+]i increase when 120 μm ruthenium red was included in the patch pipette. D, Summary histogram showing the effects of the different agents. In addition to showing the results of partsA–C of this figure, the histogram shows that 1 mg/ml of heparin in the pipette blocked release, 20 mm caffeine that was added to the ACSF blocked release, and preincubation with 3 μm thapsigargin blocked release.