
Fig. 4.
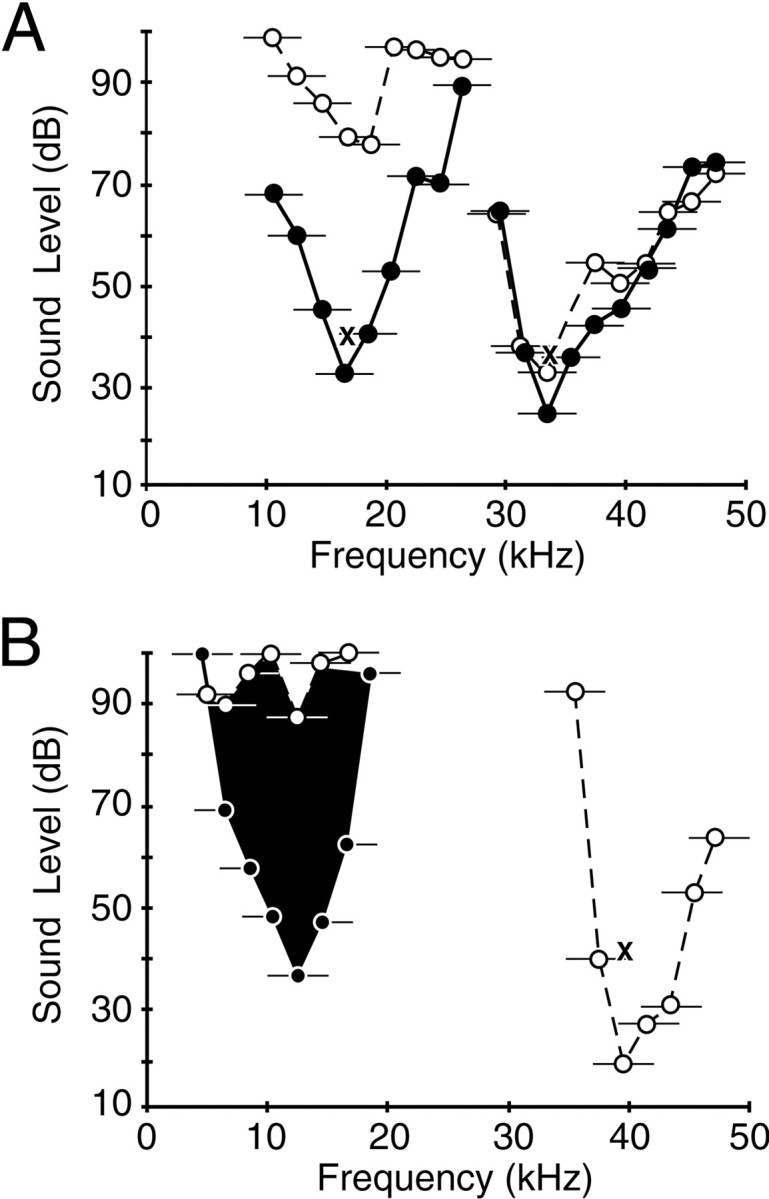
Tuning curves for combination-sensitive single units that respond best to noise stimuli. Thresholds were obtained with 5-kHz-wide noise bands, indicated in the figure by thecircles (center frequency) and horizontal lines (bandwidth). Dashed lines andunfilled circles indicate responses to single noise bursts. Solid lines and filled circlesindicate tuning curves obtained in the presence of a second noise burst, the center frequency and intensity of which are indicated by theX placed within the other tuning curve. Theblackened curve shows tuning of an inhibitory response as described in Figure 3. A, Single unit facilitated by signals in the 10–23 and 32–47 kHz frequency bands. B, Single unit excited by signals in the higher frequency band but inhibited by signals in the lower frequency band. For both units, combination effects were documented when signals were presented simultaneously (0 msec delay). The units did not respond to tonal stimuli in the 10–50 kHz range at levels as high as 80 dB SPL, the highest tested.