
Fig. 5.
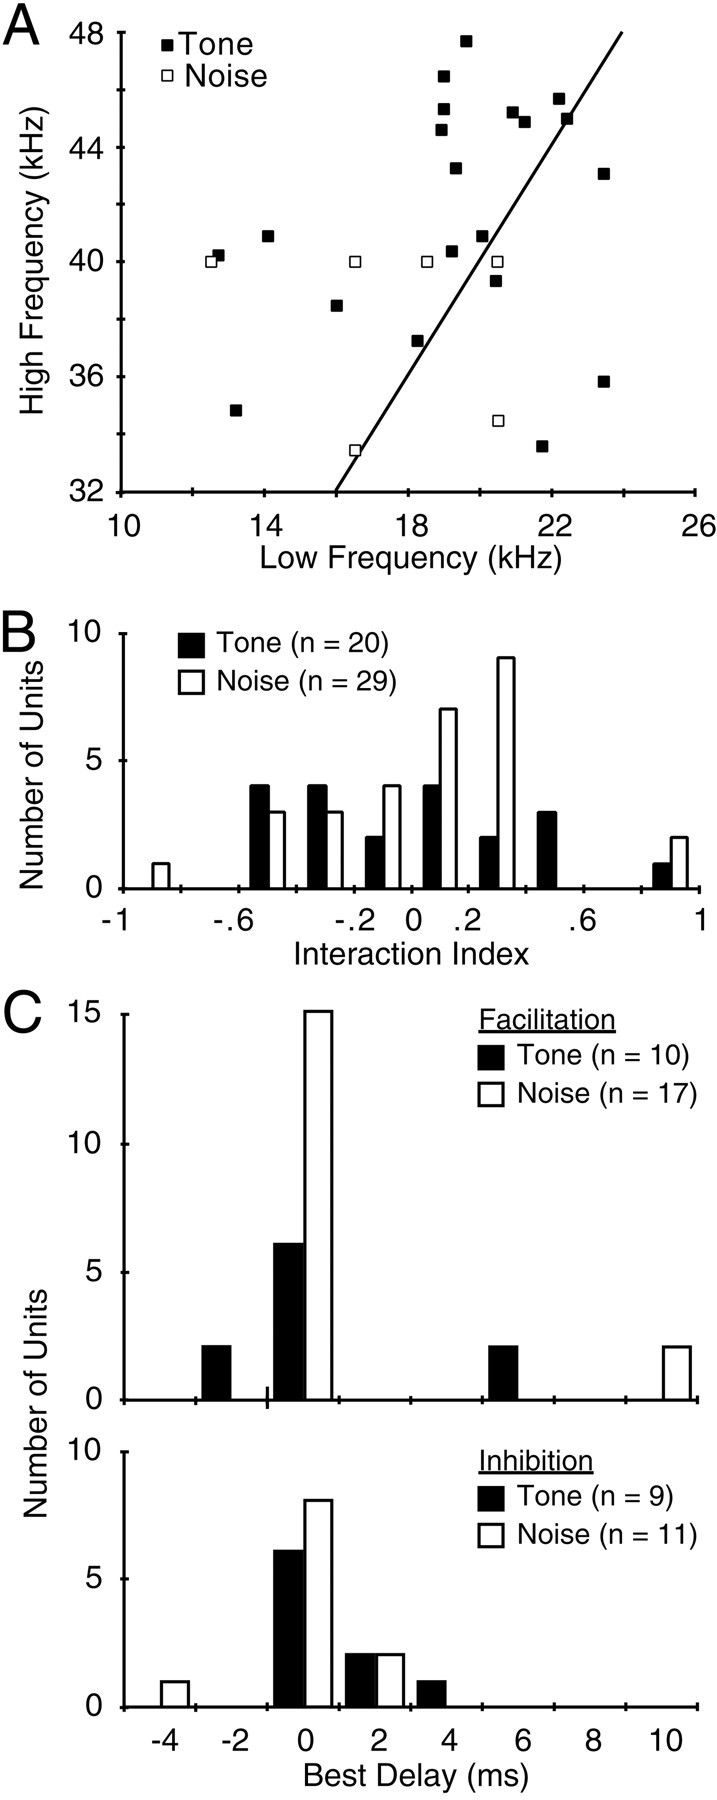
Aspects of combinatorial interactions among the recorded population of single units. A, Frequency tuning of combination-sensitive interactions. Tone indicates tone-responsive units, whereas Noise indicates units responding better to bandpass noise. The line plots an exact fundamental-second harmonic relationship. Most noise-sensitive units are not included because their best frequencies were not measured. These were stimulated with noise bursts including most of the 10–23 or 32–47 kHz bands. B, Strength of interaction, as measured by the interaction index. Only units with index values of 0.09 and greater (facilitation) or −0.11 or less (inhibition) are shown. C, Best delays among single units showing combination-sensitive facilitation (top) or inhibition (bottom).