Fig. 9.

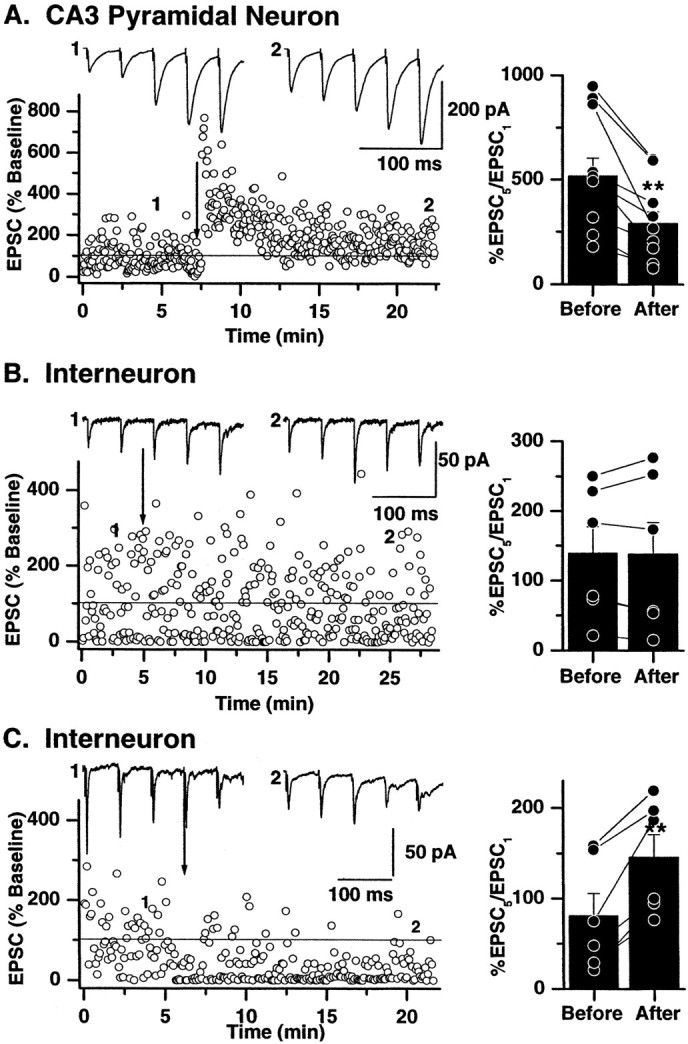
Long-term modification of synaptic efficacy alters short-term plasticity. Single representative experiments recorded from mossy fiber→pyramidal cell synapses (A), →interneuron CI AMPA synapses (B), and →CP AMPA synapses (C) are shown on theleft. Sixty EPSCs were evoked at 0.33 Hz during the control period. The low-frequency stimulation was then briefly interrupted (1), and a train of five stimuli at 20 Hz (repeated 10 times at 30 sec intervals) was delivered. The averaged response to the 10 trains is shown above the dot plots. A high-frequency stimulus was then applied (100 Hz; 1 sec; 3 times at 10 sec intervals; indicated by arrow) to induce LTP at mossy fiber→pyramidal cell synapses, no change in synaptic plasticity at interneuron CI AMPA synapses, or iLTD at interneuron CP AMPA synapses. Low-frequency stimulation was resumed, and after a period of 10–15 min the 20 Hz train was repeated (indicated by 2) to determine the impact of long-term changes in synaptic efficacy on short-term plasticity. The impact of long-term plasticity was determined by comparing the ratio of EPSC5/EPSC1 during the 20 Hz train.A, The ratio of EPSC5/EPSC1 was significantly reduced at all mossy fiber→pyramidal cell synapses after the induction of LTP. Plots on the right illustrate the EPSC5/EPSC1 data from all experiments (n = 9). Individual experiments are represented byconnected dots. The averaged change in EPSC5/EPSC1 is shown by the histogram.B, As expected, the lack of long-term plasticity at interneuron CI AMPA synapses was without effect on short-term plasticity. The plot on the right indicates the EPSC5/EPSC1 ratio from all mossy fiber→CI AMPA synapses (n = 6). No change in the mean EPSC5/EPSC1 was observed after high-frequency stimulation. C, In contrast, the ratio of EPSC5/EPSC1 was increased after induction of iLTD. In the single experiment shown on theleft the mossy fiber→CP AMPA synapse is initially depressing (averaged traces evoked by 20 Hz stimulation shown above the dot plot). After induction of iLTD the 20 Hz train EPSCs are now facilitating, and the EPSC5/EPSC1 is greatly increased. In all experiments (indicated on right), regardless of whether the synapse is initially depressing (EPSC5/EPSC1 < 100%) or facilitating (EPSC5/EPSC1 > 100%), the EPSC5/EPSC1 ratio was significantly greater (indicated by **) after the induction of iLTD.
