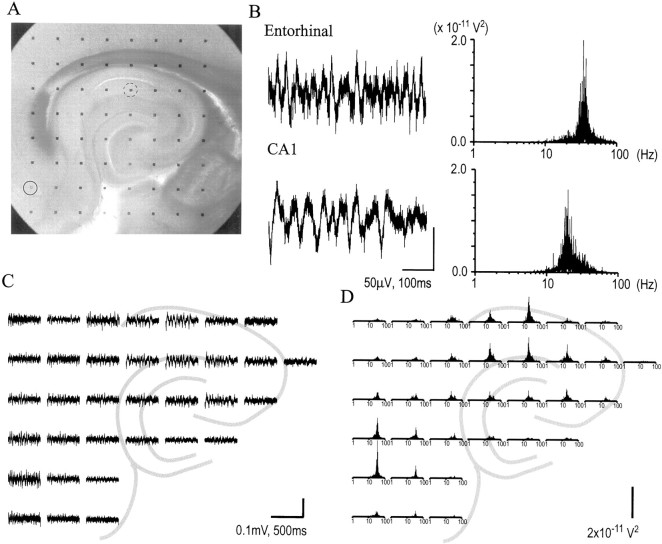
Fig. 11.
Two distinct carbachol-induced rhythms in the hippocampus and cortex. A, Micrograph of a corticohippocampal slice on a broad array. Two sites are indicated in the apical dendrites of field CA1 (dashed circle) and the deep layers of entorhinal cortex (solid circle). B, Sample activity in response to the infusion of carbachol (50 μm) from the selected electrodes in entorhinal cortex and field CA1 (left) and power spectra for recordings over 3 sec at these two sites (right). Power values are given as × 10−11. Although field CA1 exhibits β-like rhythm centered at ∼20 Hz, carbachol elicits higher frequency (35–40 Hz) activity in entorhinal cortex (top right spectrum). C, Distribution of representative activity in the slice. D, Distribution of low-pass (0–100 Hz) filtered power spectra in the slice. Gray linesindicate the position of the pyramidal and granule cell fields. Calibration bars: B, left, 50 μV, 100 msec;C, 0.1 mV, 500 msec; D, 2 ×10⁻¹¹V2.

